If there’s one looming social challenge in the United States that unifies policymakers, practitioners, and philanthropists from across the ideological spectrum, it’s this: How can we revive the American Dream?
For nearly half a century, social mobility in the United States has remained largely stagnant. Even when they “work hard and play by the rules,” people who occupy the middle and bottom quintiles of the US income distribution are no more likely to improve their economic lives than their parents and grandparents. During the 2016 presidential campaign, both Jeb Bush and Hillary Clinton declared that the American Dream is “out of reach” for millions of citizens. In a June 2014 CNNMoney poll, 6 out of 10 people deemed the Dream “impossible” to achieve.
However, by taking on a math problem—figuring out the return on big investments that aim to ignite upward mobility—we found that reports of the American Dream’s demise just might be premature.
We recently led a Bridgespan Group research project framed around this question: Could a philanthropic investment of $1 billion dramatically increase upward social mobility for millions of low-income individuals and families?
Working with an advisory board comprised of field experts, and foundation and think tank leaders, our team produced a report, “‘Billion Dollar Bets’ to Create Economic Opportunity for Every American,” which maps out 15 investments that can help low-income people build pathways and overcome obstacles to the middle class. The investments also seek to transform communities where poverty is concentrated and scale social programs that are already working. In an article published by The Atlantic, “How to Bet Big on the American Dream,” we dig deep into three of these proposed investments: Establish clear and viable pathways to careers, reduce unintended pregnancies, and support people living in high-poverty neighborhoods who want to move to economically diverse communities.
Now we must pivot from proposing big investments to actually making them.
If society expects philanthropists to step up and place some truly big bets on catalyzing upward mobility, we have to provide them with some assurance that investments of tens or hundreds of millions of dollars will likely impact large numbers of low-income people. That logic pushed our team to join with other peers who are grappling with this fundamental question: How can we calculate the social return on a big investment?
Considering the growing appetite for private funding of social change initiatives, it’s unfortunate that the sector doesn’t have a better handle on what returns investments might actually yield. But it’s not surprising. We discovered that pulling a reasonably precise return on investment (ROI) out of the muck of guestimates and “what if” scenarios can be a gritty, sometimes grueling ordeal. Here’s how we took on the task.
A Formula for Estimating ROIs
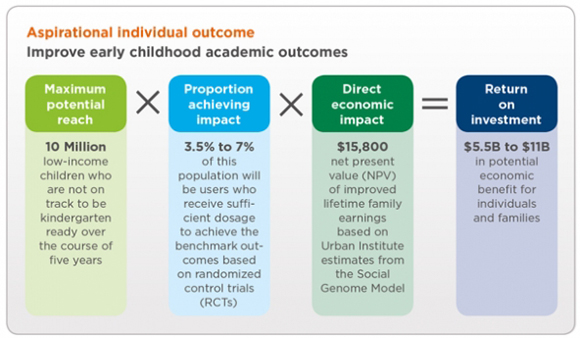
We sought to create ROI calculations by extrapolating from the vast body of research on social mobility, including longitudinal studies on factors contributing to success over the course of an individual’s life and the impact of geographic and regional variation in economic opportunities. To estimate the return on each social-mobility investment, we developed a straightforward formula: Maximum Potential Reach x Proportion Achieving Impact x Direct Economic Impact = ROI.
The formula is deceptively simple. In practice, it required that we take several leaps of faith and continually challenge our own best guesses. Consider, for example, our proposed investment for improving early childhood development to spark upward economic mobility: Create and scale a suite of tech-enabled tools (such as mobile applications that deliver “tips by text” to parents and other caregivers) that support the healthy development of very young children and prepare them for academic success.
Maximum potential reach: To calculate the bet’s ROI, we first had to figure out the overall size of the targeted population. Because this particular bet spans the entire United States (others are limited to a set of individual states), we had to calculate the number of low-income children nationwide who are not on track to be ready for kindergarten by age five.
Using data from the Early Childhood Longitudinal Study—Birth Cohort, we estimated that 5.8 million of those children are from households earning 200 percent less than the federal poverty line and are probably unprepared for formal education. With each successive year, we estimated that an additional 1.2 million children would be born into conditions that keep them off track.
By factoring in cohorts of 1.2 million children per year over the course of the investment and adding that number to the base figure of 5.8 million children, we calculated a maximum potential reach of roughly 10 million kids.
(As it turned out, this was the least controversial part of figuring out the ROI.)
Proportion achieving impact: To estimate the number of children who would directly benefit from the intervention, we had to make a number of assumptions. A $1 billon investment of philanthropic capital in early childhood development is many times larger than what the private sector has tried before. We couldn’t use other $1 billion bets as a yardstick. Instead, we had to balance the best comparable information with judgment calls on what’s reasonable to believe, both in terms of the number of parents and caregivers who would participate in tech-driven programs to support very young children and the intervention’s efficacy.
To calculate an app’s capacity to improve the academic readiness of very young children, we drew from the evidence base of programs similar to what we imagined, including a randomized control trial (RCT) of Ready4K, a text-messaging program that helps parents prepare their preschoolers for kindergarten. The trial showed that Ready4K significantly improved academic outcomes and kindergarten readiness for young children. (For the wonks among us, the improvement is 0.21 standard deviation in emergent literacy scores for young children entering kindergarten.) Other studies of programs like Text4Baby and tools developed by the LENA Research Foundation also highlighted promising results, which gave us confidence that mobile applications would make a difference in the lives of young children.
The next step was to figure out the portion of the targeted population that would achieve a similar result.
Research tells us that roughly 50 percent of adults making less than $30,000 a year have access to Web-enabled phones. But that piece of data doesn’t account for the fact that parents of children under five are usually younger. After all, about 85 percent of people under the age of 30 own smartphones. So we split the difference and estimated that 70 percent of the target population would have access to mobile applications—a large population to draw from.
Of course, just because parents have access to mobile apps like Ready4K doesn’t mean they’ll use them. How could we estimate, with any degree of accuracy, the percentage of parents who would take full advantage of the tech tools?
Within the field of digital media, there is a generally accepted rule of thumb called the “90-9-1” principle, where 1 percent of people who leverage social media are “super users,” accounting for most of the platform’s activity; 9 percent of users are “highly interactive,” demonstrating significant engagement; and 90 percent are passive users. We multiplied the percentage of low-income parents in the targeted age range who have access to Web-enabled phones by the percentage of “super” and “highly interactive” users of social media. We wanted to err on the conservative side, so we cut the estimate in half. The result: Just 3.5 percent to 7 percent of low-income parents would avail themselves of the applications’ full potential.
We vigorously debated all of our assumptions, and tried to leverage the best data we could surface and the best thinking we could muster internally. We also shared our estimates—and all of the caveats that went into them—with third-party researchers who vetted our sources and logic.
Direct economic impact: We used secondary research to estimate the reach and the yield on our investments, but we needed the Social Genome Model (SGM) to complete our formula’s last element. Created by the Brookings Institution, the Urban Institute, and Child Trends, the SGM is a tool that allows researchers to assess different strategies that seek to support individuals as they encounter milestones that mark each stage of life, from early childhood to early adulthood. Using longitudinal data, the model helps researchers estimate a strategy’s impact on an individual and family’s future earning potential. By leveraging the SGM, we modeled out potential scenarios—such as avoiding a criminal conviction, delaying a pregnancy, or completing a postsecondary certificate—that would support low-income people who are trying to make it to the middle class.
For the bet on early childhood development, we worked with the team at Urban to set an appropriate level of academic improvement for a low-income child who’s preparing to enter kindergarten. (One last wonk alert: We used 0.21 standard deviation improvement in cognitive reading scores and simulated how that impact would build throughout a person’s life.) In this case, improving a low-income child’s academic readiness would yield an impact of $15,800 in increased lifetime family earnings.
We then pulled together the formula’s disparate parts: 10 million (Maximum Potential Reach) x 3.5 to 7 percent (Portion Achieving Impact) x $15,800 (Direct Economic Impact) = $5.5 to $11 billion (ROI). Put another way, a $1 billion investment in scaling a suite of tech tools for early childhood development would yield returns of at least $5.5 billion and at most $11 billion—a worthy return by any measure.
The Enemy of the Good
The ROIs we calculated were a vital part of our overall social-mobility research, allowing us to make apples-to-apples comparisons between fundamentally different bets, such as supporting early childhood development versus reducing unintended pregnancies. As we worked to develop them, we used the principle of “Don’t let the perfect be the enemy of the good” to overcome inevitable obstacles.
Our estimated returns on all the investments, including early childhood, are riddled with assumptions. We’ve assumed that ambitious initiatives that span the United States can match or even improve on promising outcomes from smaller projects and pilot programs. In some instances, we’ve relied on the results from RCTs like Ready4K that, while rigorous, have not yet been replicated. And how do we know that an investment in, say, reducing mass incarceration will overcome political gridlock or outright opposition?
And yet, we believe the practice of developing ROIs is meaningful. Even an estimated ROI can help philanthropists determine whether they want to target a broader population with a lower direct impact or invest in strategies that optimize individual lifetime earnings for a smaller population.
We recognize that no single formula—including our own—can fully forecast the yield on interventions that might take years to play out. Our attempt is very much a work in progress, and part of gathering momentum toward tracking and evaluating results. We’re seeing promising experiments in collecting data on the effectiveness of programs, including “low cost” RCTs, newer approaches to formative evaluations, and novel methods for mapping programs onto meta-analyses of existing research. If the trend continues, we should have the data to estimate returns with greater precision—and thereby give private donors more confidence to make bigger bets.