Appendix A: Bridgespan Analysis of National Center for Charitable Statistics Data
Related Articles
In addition to studying 20 youth-serving organizations in depth, we also looked at the youth-service domain from a macro-economic perspective. Doing so allowed us both to size the growth challenge as well as to set the parameters for choosing organizations to explore in greater depth. We analyzed a dataset provided to us by the National Center for Charitable Statistics (NCCS). This dataset contained information from IRS Form 990 documents, for the years 1996 through 2002, and allowed us to track total annual revenue by size of organization, sub-domain, organizational structure (affiliated vs. stand-alone), geography, and age of organization. Among the findings:
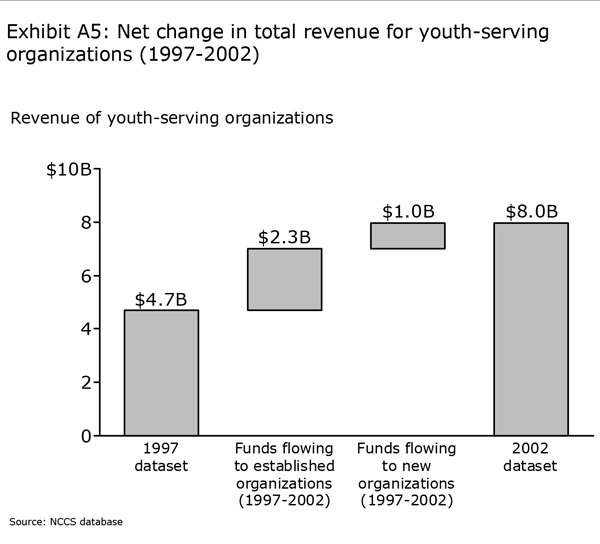
- Growth in the youth-service domain was quite strong over the six-year period of 1997 to 2002, in terms of the number of organizations in the domain (41 percent growth, from 5,079 organizations to 7,164 organizations) and the total funds (70 percent growth, from $4.7 to $8.0 billion).
- While much of this new funding was directed to established organizations, one-third ($1.0 billion) went to newly created nonprofits.
- Funds did not flow uniformly across the sector. The $3.3 billion in total domain revenue growth was distributed unevenly by size of organization, sub-domain, organizational structure (affiliated vs. stand-alone), geography, and age of organization. For example, the largest organizations received a disproportionate share of the total funds.
- The vast majority of youth-serving organizations experienced an increase in overall revenue. We tracked all organizations for which we had data for each year in the timeframe. Seventy-three percent experienced revenue growth. The average compounded annual growth rate was 8 percent.
- However, the rate of growth varied dramatically, and growth was unstable for most organizations. Only 9 percent of the organizations in our sample experienced steady, uninterrupted revenue growth over the time period.
- The revenue growth rate and the stability of that growth varied (on average) by size of organization, sub-domain, organizational structure (affiliated vs. stand-alone), geography and age of organization.
In conclusion, while a strong, steady growth rate is rare, it is not an unattainable goal for organizations and their funders.
Data source and methodology
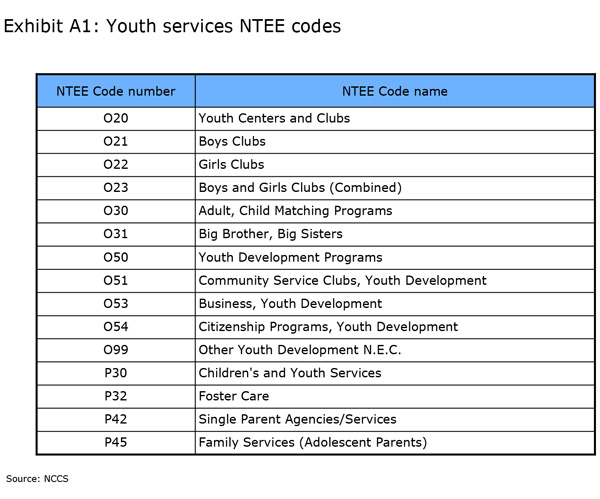
We defined the youth-service domain by using National Taxonomy of Exempt Entities (NTEE) codes. NCCS maps these codes to organizations. We considered two major groupings of codes: “youth development” (the “O” codes), and “human services” (the “P” codes). Under those two major groupings, we identified 15 codes containing organizations that provide services predominately for children and youth. We did not include codes under those categories that included pure advocacy organizations, pure research organizations, or pure fundraising organizations. We also did not include scouting, adoption, day care, and full-family organizations.
By choosing only the 15 codes, we recognize that we excluded three groups of organizations: those organizations that offer some services for youth, but are not considered sole providers of youth services; those organizations whose primary NTEE code is not within our group of 15; those organizations that were not coded correctly. (For a full list of the 15 codes, see Exhibit A1.)
Once we identified the NTEE codes, we purchased a database from NCCS that contained data for all U.S.-based organizations under those codes. We obtained data for the years 1996 to 2002. If an organization did not file a Form 990 in a given year, then the organization was not in our database for that year. As well, we should note that only those organizations with annual gross revenue of $25,000 or greater must by law file Forms 990. Therefore, our dataset (and subsequent analysis) excluded numerous small organizations.
As a result of this selection process, we created a database for the year 2002 comprised of 7,164 organizations. These organizations had revenue that totaled $8.0 billion for that year. In 1997 (the earliest complete year of data we could obtain), the database contained 5,079 organizations, with revenue totaling $4.7 billion. Between the years 1997 and 2002, many organizations dropped out of the database because they did not file Forms 990. Likewise, many new organizations were added to the database. We will discuss this phenomenon in the “A Growing Domain” section that follows.
For a subset of our analysis, we selected only those organizations where we had annual data for every year between 1996 and 2002. This yielded a sample of 2,839 organizations, which allowed us to track the growth paths of these organizations, over a full seven-year period. We looked at the qualitative nature of those organizations (i.e., size of organization, sub-domain, affiliated vs. stand-alone, geography, and age of organization) and are confident that this sample is representative of all organizations that fit our definition of “youth services” organizations.
A growing domain
Growth in the youth-service domain was strong over the period 1997 to 2002, in terms of both number of organizations in the domain and the revenue of those organizations. We compared this growth to growth rates in the private sector, in the macro-economy, and in other nonprofit domains.
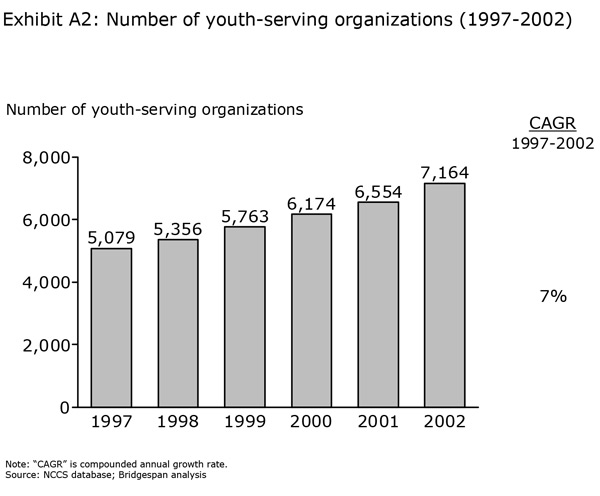
The number of organizations in the domain grew 41 percent over the six years, from 5,079 to 7,164. In particular, 914 organizations dropped out of the database, while 2,999 were added into the database, resulting in a net addition of 2,085 organizations. This translates into a 7 percent compounded annual growth rate. (See Exhibit A2.) Over the same period of time, the number of U.S. firms registered with the U.S. Census bureau grew by a total of only 3 percent.
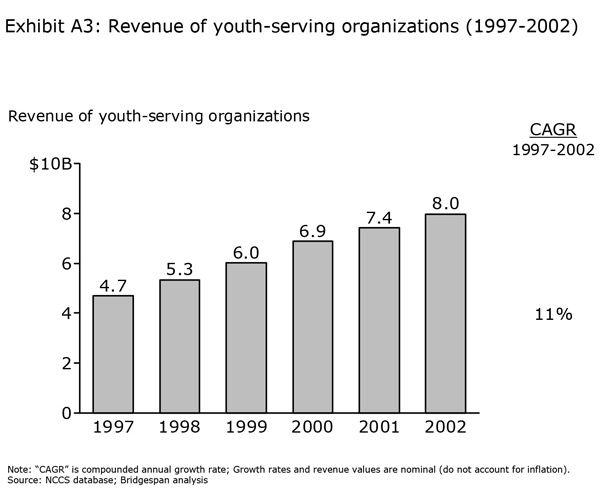
The revenue of the organizations in the domain grew 70 percent over the six years (in nominal terms), from $4.7 to $8.0 billion. This translates into an 11 percent compounded annual growth rate. (See Exhibit A3.) Over the same period of time, the U.S. GDP grew at a compounded annual rate of only 5 percent (in nominal terms). As well, over the same time period, revenue of the Fortune 500 grew at a compounded annual rate of only 5 percent (in nominal terms).
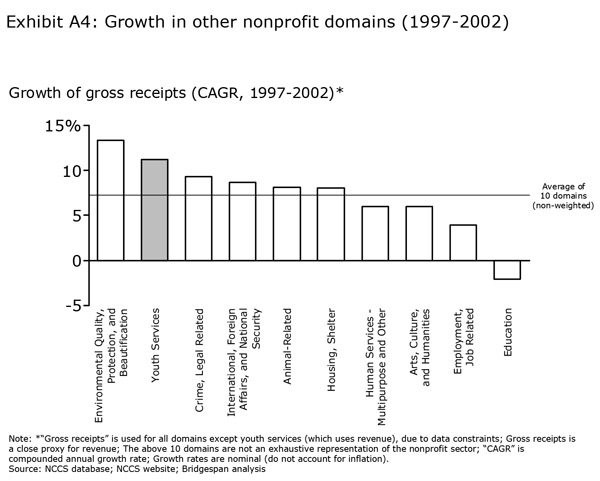
To compare growth of the youth-service domain with growth of other nonprofit domains, we looked at the growth rates of nine other domains, including: Education; Environmental Quality, Protection and Beautification; Arts, Culture and Humanities; and Employment, Job Related. We obtained this data from the NCCS website, using gross receipts as a proxy for revenue due to data availability. Revenue growth in the youth-service domain outpaced the gross receipts growth in eight of the nine domains. (See Exhibit A4).
Where the funds flowed
We have already established that the youth-service domain grew quickly over the time period, increasingly by $3.3 billion. But where did those funds flow?
Approximately 70 percent ($2.3 billion) of this new funding was directed to established organizations. However, the remaining 30 percent ($1.0 billion) was directed to nonprofit organizations created in the domain over the time period. (See Exhibit A5.)
Funds did not flow uniformly across the sector. That is, the $3.3 billion in total domain revenue growth was not distributed evenly by size of organization, sub-domain, organizational structure (affiliated vs. stand-alone), geography and age of organization:
- The largest organizations received a disproportionate amount of the domain’s total funds. In 2002, organizations with revenue greater than $3 million (5 percent of all organizations) received 52 percent of the total revenue in the domain. In the same year, organizations with revenue less than $1 million (86 percent of all organizations) received only 26 percent of total revenue in the domain.
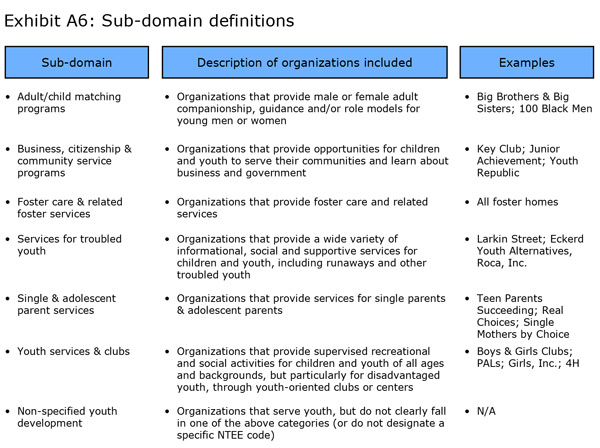
- The three largest sub-domains, in terms of total revenue, were youth centers and clubs, services for troubled youth, and foster care and related foster services. (For definitions of each sub-domain, see Exhibit A6.) In 2002, these sub-domains accounted for 12 percent, 33 percent and 7 percent of the total number of organizations, and received 24 percent, 35 percent, and 18 percent of total revenue in the domain (respectively). They were also among the fast growing sub-domains, in terms of compounded annual growth rates, over the six-year period.
- In 2002, organizations that were affiliates of a larger national network accounted for 39 percent of all organizations in the domain, but only 28 percent of total revenue. These organizations include (among others): Boys and Girls Clubs affiliates; Big Brothers Big Sisters affiliates; and Junior Achievement affiliates. In fact, those three types of affiliates dominated their respective sub-domains in terms of total revenue in 2002: Boys and Girls Clubs affiliates accounted for 77 percent of total revenue in the youth centers and clubs sub-domain; Big Brothers Big Sisters affiliates accounted for 93 percent of total revenue in the adult/child matching programs sub-domain; and Junior Achievement affiliates accounted for 51 percent of total revenue in the business, citizenship and community service programs sub-domain. In sum, affiliated organizations grew at the same rate as stand-alone organizations between the years 1997 and 2002, in terms of total revenue.
- Funds flowed fairly evenly across geographic regions. In 2002, each of the four major U.S. regions (northeast, south, midwest, and west) contained roughly the same number of youth-serving organizations, but organizations in the northeast tended to be slightly larger than organizations in other regions. As a result, those northeast organizations accounted for 35 percent of total domain revenue in 2002. That said, revenue growth in the northeast between 1997 and 2002 was relatively slow. Compounded annual growth rates for the time period are as follows: northeast, 9 percent; south, 15 percent; midwest, 8 percent; west, 14 percent.
- Older organizations tended to receive a larger share of domain revenue than younger organizations in 2002. That said, older organizations did not necessarily grow faster than younger organizations over the six year period.
The paths of growth (and decline)
The vast majority of youth-serving organizations in our sample experienced an increase in overall revenue over the time frame, but the rate of growth and the stability of growth varied dramatically.
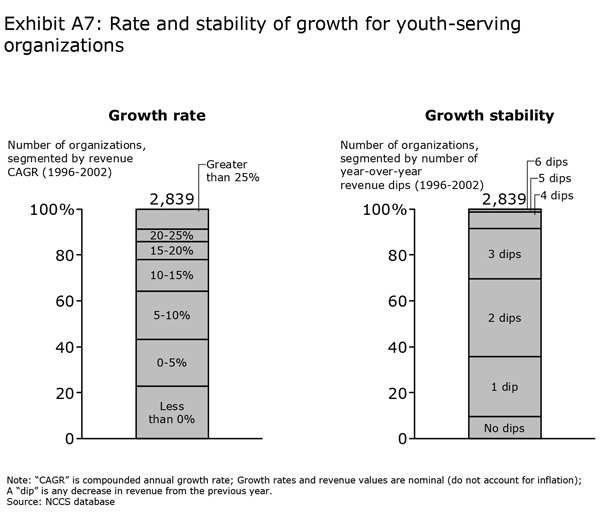
We tracked all organizations for which we had data for each year over a seven year time period of 1996 to 2002 giving us a sample of 2,839 organizations. We should note that, by definition, our sample excludes those organizations that fell out of the database over the years. Those organizations likely went out of business, or shrunk below $25,000 in annual receipts. Of the 2,839 organizations, 73 percent experienced revenue growth over the seven years. At the same time, 23 percent of organizations experienced negative growth over the seven years. The average compounded annual growth rate for those organizations was eight percent. (See Exhibit A7.)
While growth did occur for most organizations, that growth was often unstable. We measured stability by looking at the number of year-over-year revenue dips over the time period, for each organization. Out of our sample of 2,839 organizations, only 9 percent experienced steady, uninterrupted revenue growth over the time period (i.e., no year-over-year revenue dips). Twenty-six percent experienced one dip, 34 percent experienced two dips, 22 percent experienced three dips, and the remaining 9 percent experienced four or more dips. The average organization experienced two revenue dips. (See Exhibit A7.) The picture is only slightly more positive if we define a “dip” as a year-over-year decrease of more than five percent. Using this definition, 81 percent of organizations still experienced one or more dips over the time period.
Did growth paths vary for different types of organizations? Once again, we analyzed the data by looking at size of organization, sub-domain, organizational structure (affiliated vs. stand-alone), geography and age of organization. We performed two-sample T-tests to check for statistically significant differences in average growth rates and number of year-over-year revenue dips for organizations in different categories.
Stand-out observations are below:
- There were some statistically significant variations in growth rates and growth stability by sub-domain, but nothing dramatic.
- There were some statistically significant variations in growth rates and growth stability between affiliated organizations and stand-alone organizations, but nothing dramatic.
- Organizations in the northeast and midwest grew at a significantly lower rate (on average) than organizations in the south and west. There were no significant differences in growth stability by region.
- Younger organizations (less than 15 years old) grew at a significantly higher rate (on average) than older organizations. There were no significant differences in growth stability by age of organization.
- There were no significant differences in growth rates by size of organization. However, a non-statistical evaluation of the data suggests that organizations tend to hit “funding walls” at $2-to-4 million, and at $25 million. That is, it appears than many organizations tend to find themselves stuck at those revenue points, and struggle to climb over the walls and continue to grow. That said, statistical analysis shows that larger organizations experienced more stable growth paths than smaller organizations.
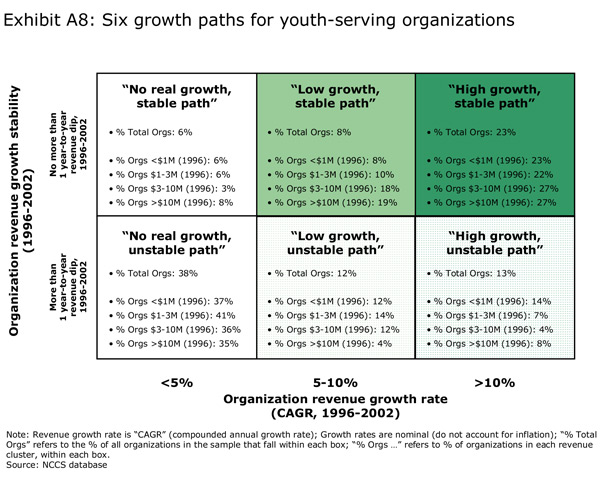
As a result of this analysis, we grouped organizations into six major funding paths, taking into account both the amount of revenue growth and the stability of that growth. (See Exhibit 8.) While 23 percent of all organizations were in the top right quadrant, experiencing the “high growth, stable path,” 38 percent were in the bottom lower quadrant, experiencing the “low growth, unstable path.” Therefore, while a strong, steady growth rate is rare, it is an attainable goal for organizations and their funders.
Appendix B: Methodology for the Study
There are many possible avenues for trying to learn more about the question of growth. For instance, one could study the organizations directly serving youth, or compare the efforts of those that are trying to support growth. Within those categories, a study could range from a broad review of many organizations to an in-depth analysis of one or a few, and it could consider the experiences of those that have succeeded or failed in their efforts (or a sampling of both). After much discussion, we decided that a potentially powerful line of inquiry would be to look at a set of 20 youth-serving organizations that had all experienced significant growth in the past five to seven years.
Several assumptions are embedded in this approach. First, we believe that much can be learned about how to support growth by looking at the organizations providing services themselves rather than undertaking a comparative study of foundations or other supporting organizations. The latter may also prove valuable, but we believe that examining the organizations on the front lines can offer a useful vantage point for understanding growth. We expected that this study would identify trends that could then be explored by a more in-depth look at supporting organizations if such an effort was deemed worthwhile.
Second, we decided to take a relatively intensive look at 20 organizations rather than a narrow view of a much larger sample set or a comprehensive study of a few organizations. The latter approach has been quite common through case studies or articles that look at the experiences of several organizations. Looking at a significant number of organizations allows for a consideration of trends as well as varying approaches to a relatively common set of challenges. Clearly it does not allow for statistically significant findings; but it has the advantage of producing far greater depth than a similar investment in a much broader study.
Third, we looked at examples of successful growth rather than those organizations that failed in their pursuit of expansion. The primary reason for doing so was that one of the chief topics of interest was the effect of growth on an organization, which cannot be addressed by looking at those unable to succeed. Two cautions are warranted on this point.
We defined success in terms of the organization’s ability to increase significantly the reach of its services (as measured by growth in the number of youth served and in the organization’s revenues) and not in terms of the quality and effectiveness of those services (as measured by good youth-service programming and by positive effects on the participants). To assess the latter, we would have had to evaluate each program and compare the results of growth to other options (such as program improvements) that the organization itself could have taken or that its funders could have chosen—both of which were beyond the scope of this study.
The relationship between growth and quality, in the nonprofit sector generally and the youth-service domain specifically, is a critically important issue, and deserves to be studied in its own right; but it was not the focus of this project. Inclusion in this paper reflects neither positively nor negatively on the quality of the programs the participating organizations provide, therefore, but only on the fact that they were able to expand significantly the delivery of those programs.
Also, while we do believe that it is possible to draw implications from the experiences of these organizations, the fact that we have not considered examples of organizations where the same factors were present but growth failed to occur warrants caution in taking these insights too far. Even though some of the findings appear to be quite robust, they should nonetheless be taken with the warning that the sample is skewed.
With these basic ideas in mind, we selected a group of 20 organizations. The initial list of potential participants was generated through several sources: Clark grantees, Bridgespan clients, sector experts, and a database from the National Center for Charitable Statistics (NCCS). Within this set, we looked for organizations that:
- Are primarily direct-service organizations that focus on youth
- Operate in the continental United States
- Over a recent period (approximately seven years) experienced substantial revenue growth, and fit roughly into the following size parameters: $500,000 to $2 million before experiencing growth, and $3 million to $25 million after experiencing growth.
- Have increased the number of participants they have served (as well as potentially increasing the extent of services offered to those participants)
We used revenue as a proxy for growth, because it indicates that the organization was facing the type of challenges (such as increasing fundraising capacity or adding to its infrastructure) that we wanted to study. We also wanted to consider organizations that have grown, at least in part, by adding new participants, as it creates a different set of issues than those that are only adding new services for existing participants. (That said, we did not find any organizations in the latter category that met our size criteria.)
All of the organizations that were invited agreed to participate. They can be categorized into three basic types. First, there are organizations such as Jumpstart and Public Allies that have attempted to expand nationally, at least to some extent. These fit the classic conception of replication.
Second, there are organizations that have grown either locally or regionally. We believe there are valuable lessons to be learned from organizations that have remained committed to increasing their penetration in the same geographic location, either through their existing site or through new sites. Given the complexity of problems facing youth, we considered it important to include organizations that grow by increasing their expertise and service to a population of youth in one specific locale.
Third, we included local affiliates of some of the more established national networks like Boys and Girls Club and Girls, Inc. These organizations have played a critical part in the growth of the domain. For example, Big Brothers, Big Sisters accounted for about 90 percent of the over $200 million spent on adult/child matching programs in 2002, while Boys and Girls Clubs received almost three out of every four of the nearly one billion dollars invested in youth centers and clubs in the same year.[1] Given the enormous presence of affiliate networks in this domain, it would be a gross oversight to undertake a study of growth among youth-serving organizations while excluding them. However, the nationals are much too large to provide an accurate comparison point to the other organizations. They also face very different issues, whereas their affiliates face similar challenges to stand-alone organizations, because they operate with a significant level of autonomy, even though they are members of national networks.
Sources Used for This Article
[1] NCCS database.
