Performance is the ultimate test of any organization. For nonprofits, that means successfully fulfilling their missions, whether creating more access to health care, mitigating climate change, helping more students to complete college, or securing living-wage jobs for the under-employed. Whatever the mission, nonprofits have felt an extra burden to deliver in the wake of the Great Recession, which increased populations at risk and drove funding austerity. Rising to this historic challenge has placed a premium on sound management.
The heightened importance of strong nonprofit management calls attention to a wide range of management practices that we call tools. Despite their importance, to date there has been no systematic attempt to understand what tools are being used or how effective they are. This report aims to fill that knowledge gap. It creates a "consumer report" for nonprofit leaders seeking to apply one or more of 25 popular tools (see our resource center for the full list and descriptions) to the challenges at hand. These tools can help organizations live up to their missions—and meet funders' expectations for results. Many of the tools on our list, such as scenario planning and benchmarking, migrated from the business world. Others, such as funding models and constituent engagement, evolved specifically with nonprofit needs in mind (see sidebar, "What Is a Nonprofit Management Tool?").
What is a Nonprofit Management Tool?
Nonprofit leaders and sector experts could debate an exact definition of a “management tool” endlessly, but for the purposes of our survey, we decided that a tool needed to meet three criteria:
- It can be described by a well-defined process (e.g., strategic planning), framework (e.g., intended impact and theory of change), or product (e.g., social media programs).
- It should address a specific need within nonprofit organizations.
- It should be captured in the nonprofit lexicon via publishing or other media.
To understand how many tools a typical nonprofit uses, for what purposes, and how they perform, The Bridgespan Group developed a survey of the top nonprofit tools and trends in the social sector, nominated by a panel of more than two dozen practitioners, funders, and intermediaries. We modeled our research after a similar business survey used by Bain & Company since 1993 (see the sidebar at the end of this report, "How We Developed the Survey"). The Bridgespan survey gauges current and anticipated use of 25 tools (see chart 1, 25 Management Tools), user satisfaction, and how effort relates to favorable ratings. In addition, the survey queries social sector leaders on 21 trends (see chart 2, 21 Management Trends) to see how the most popular tools connect with the current thinking about what it takes to manage effectively. Trend topics ranged from attitudes toward performance measurement to big-data analytics.

click image for larger view

click image for larger view
Overall findings confirm nonprofits’ widespread use of management tools and their interest in using more in the future. The survey also provides insights into how well those tools help leaders respond to trends in the sector. It is our intent that this report will be repeated at intervals and will serve to stimulate questions, test practices, spark experiments, and ultimately help managers to get better results.
Highlights include:
- Tool use is widespread and nonprofits anticipate using more in 2015.
- Relationship-oriented tools are popular throughout the sector, with partnerships and collaboration (ranging from formal associations to joint programs, shared support functions, and mergers) rising to the top in use and satisfaction.
- Respondents largely find the tools they use to be effective. Increasing effort to apply them usually—but not always—leads to significant increases in satisfaction.
At the same time, some surprising findings emerged that highlight gaps between trends and practice. Among them:
- Tools and trends at times diverge. Misalignment occurs between opinions on trends and related tool usage in two prominent cases.
- First, nonprofit leaders see a need to increase performance measurement both to strengthen their impact and case for program funding, but few believe funders will increase support for evaluations.
- Also, many nonprofits consider talent management a key issue, but 60 percent have not taken advantage of tools that could help assess and develop employees.
- First, nonprofit leaders see a need to increase performance measurement both to strengthen their impact and case for program funding, but few believe funders will increase support for evaluations.
- Leaders' attitudes toward specific approaches to growing their organizations' impact vary dramatically by size of organization (e.g., organizations of all sizes are betting on partnerships and collaboration, but larger ones are more likely to explore technology and for-profit models).
1. Tool Use Widespread and May Grow
The survey results made clear that management tools are already widely used at organizations of all types and sizes. Over half use 11 or more tools, with the largest organizations ($50 million-plus in revenue) using more—an average of 14 tools in 2014—and smaller organizations, fewer—nine tools on average used by organizations under $1 million (see chart 3, Nonprofits Intend to Increase tool use in 2015).

click image for larger view
For 2015, survey respondents projected even higher tool use. Ninety-one percent said they planned to use 11 tools or more. The smallest organizations anticipate the biggest increase—doubling from 9 to 18. Organizations between $1 million and $50 million expect to use 19 tools on average, and the largest organizations anticipate using 21. Whether organizations, particularly smaller ones, could effectively use so many tools, however, is an open question. The survey answers may reflect more aspiration than an actual ability to deliver on plans, as precedents show tool use tends to go down over time as an organization gains insight on what works. In Bain's business survey, for example, while respondents regularly report that they plan to use more tools in subsequent years, overall tool usage has actually declined by roughly one-third since 2006.
Nonprofit leaders we interviewed, in fact, recommended that organizations be extremely thoughtful about which tools they intend to use, allocate sufficient time to understand how best to implement them—and be patient (see sidebar, "Patience Is a Virtue—and a Necessity").
Patience is a Virtue—and a Necessity
In talking with nonprofit leaders who took the survey, one theme became clear— don't expect any tool to yield quick results. Leaders repeatedly noted that getting maximum value from tools required spending time to understand best practices for implementation and use, developing effective change-management processes, and being willing to learn from mistakes and keep trying. As a result, implementations can often take years, which can be difficult but necessary to explain to funders supporting the efforts.
"Funders work on short time horizons, and we don't," said Michael Zisser, CEO of University Settlement, a $23 million human services organization in New York. "No matter how good you are, some stuff just takes time. And if you don’t understand that, don’t start."
Patience requires being careful in tool choice and implementing selectively, rather than flooding the organization with new tools. “You can overwhelm people with too much," said Dennis Richardson, president and CEO at the Hillside Family of Agencies in Rochester, NY. "So we try to be selective over time in choosing where we will apply those tools and with whom, and how extensively we would use them across the organization."
Other respondents cautioned that implementation is often a long-term process. Jeremy Kohomban, president and CEO of Children's Village in New York, noted that his organization allows two years for implementation of any significant new tool and makes sure that funding for that period is already in place before it starts. "We believe that at minimum you need to spend at least two years with new models," he said. "We need that time to get out of our own way before we can understand and evaluate the efficacy of the model."
A number of tools appealed to organizations of all sizes. In fact, two-thirds of the survey respondents used the top five tools: partnerships and collaboration (86 percent), social media programs (78 percent), strategic planning (70 percent), program evaluation (69 percent), and performance measurement and improvement (66 percent), (see Chart 4, Rank and use of tools varies between 2014 and 2015).
Size did make a difference for adoption of some tools. The largest organizations, for example, used tools such as knowledge management systems, which are high-cost but potentially high-return if implemented effectively, at twice the rate of smaller nonprofits (55 percent compared with 26 percent). Larger organizations also were more likely to take advantage of tools gaining in popularity, such as design thinking and big-data analysis, which were the least-used tools in 2014 but seem poised for dramatic growth in 2015.

click image for larger view
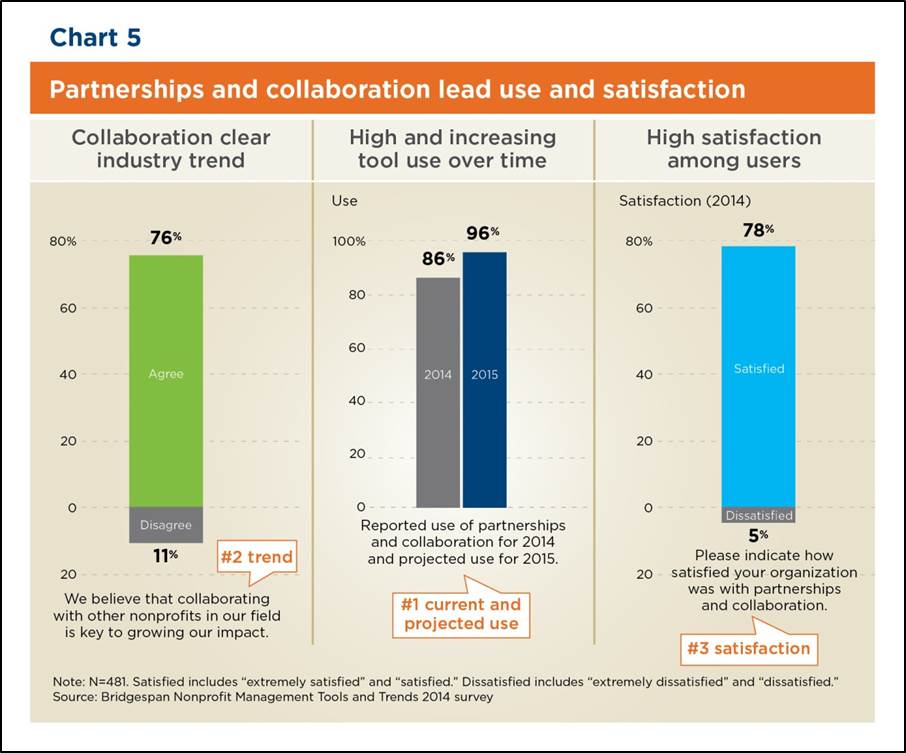
2. Relationship Tools Lead the Way in Usage and Satisfaction
Partnerships and collaboration ranked the most popular, and came third in terms of user satisfaction (see chart 5, Partnerships and collaboration lead use and satisfaction). Eighty-six percent of nonprofits engaged in partnerships and collaboration in 2014, and almost all (96 percent) expect to do so in 2015. Three-quarters reported satisfactory outcomes. These results squared with our trends survey data, where three-quarters of respondents said that they believed collaborating with other nonprofits in their field would be key to growing their impact. In fact, collaborations were the only tool cited by the majority of nonprofits of all sizes as their likely path to growth.
click image for larger view
This finding may not seem surprising, given that the nonprofit sector thrives on relationships, and the survey showed clearly that other tools designed to strengthen external relationships are favorites among nonprofit leaders. Four of the 10 most-used tools in 2014 focused on making and improving connections between organizations and their beneficiaries, funders, or other nonprofits. In 2015, nonprofits expect to further expand their use of relationship-related tools, with "beneficiary satisfaction measurement" rising into the top 10.
3. In General, Satisfaction with Tools Is High
Segmentation aside, the data clearly show overall satisfaction with management tools. No tool received less than a 53 percent "satisfied" or "very satisfied" rating (the lowest being knowledge management), nor did any receive greater than 13 percent "dissatisfied" or "very dissatisfied" (social media).
Planning tools satisfy, analysis tools disappoint
Tools related to getting clear on strategy—mission and vision statements, strategic planning, theory of change, and scenario and contingency planning—ranked at the top for user satisfaction. Nonprofits employ these tools periodically, which can tend to galvanize attention and effort. Next in satisfaction are tools related to "taking advantage of new opportunities"— partnerships and collaboration, design thinking, and collective impact collaborations. These tools tend to galvanize purposeful thought and discussion on field-level goals and aspirations.
Meanwhile, tools classified as "understanding your environment"—big-data analytics, market mapping and landscape analysis, beneficiary and donor segmentation, and funding models—fell to the bottom half of satisfaction rankings (see chart 6, Tool users are largely satisfied with tool results). All these tools involve data collection and manipulation, and creating frameworks and models, the kind of time-consuming analytical work that's more taxing than working with tools involving idea generation and decision making. In addition, two tools for measuring and extending results—donor relationship management and knowledge management systems—also ranked low in user satisfaction. Both involve major technology investments as well as significant retraining of staff to take advantage of new systems.

click image for larger view
No pain, no gain
The old saying "you get out what you put in" holds true with management tools.
In general, respondents that applied more effort reported greater satisfaction with results (see chart 7, Satisfaction generally increases with greater effort). But how much more satisfaction came with more effort varied significantly depending on the tool in question. Complex, highly analytical tools, such as organizational effectiveness diagnostics and program contribution analysis, yielded dramatically higher satisfaction (more than 40 percentage points) when respondents noted a major effort versus a limited one. Knowledge management, where sound implementation requires acumen for both technology systems and change management, stood out as an anomaly. The variance in satisfaction between high and low effort users was only 20 percentage points, and even 10 percent of major-effort users remained dissatisfied. This tool appears hard to get right.
Richard Cohen, president and CEO at Public Health Management Corporation (PHMC), a multiservice health nonprofit in Philadelphia, noted that PHMC attempts to install an organizational knowledge management system have required considerable effort that has yet to yield much in the way of results. "You have to spend a fortune after you've already spent a fortune," Cohen said, noting that the system it chose looked robust and came with good references, but has yet to pay the expected dividends.

click image for larger view
4. Tools and Trends at Times Diverge
Management tools serve immediate needs. But what about aspirational and future needs? Do the tools available today align with trends in the social sector, such as building sustainable funding models, betting on technology to increase impact, or increasing investment in program evaluation? Our survey asked respondents to tell us how well 21 trends in five categories describe their organizations' challenges and opportunities. Our goal was to understand just how trends and available tools aligned. Misalignment occurred most prominently in two cases: performance measurement and talent management.
Few nonprofit leaders believe funders will adequately support evaluation
It's no secret that nonprofits find it hard to come by funding for performance measurement and evaluation. (See The Center for Effective Philanthropy's "Room for Improvement" report for one recent example.) And our survey underscored the disconnect: 81 percent of respondents said that they agreed or strongly agreed with the statement, "Funding for organizations like mine will be increasingly tied to program outcomes or evidence of success," while only 18 percent agreed or strongly agreed that, "Our funders are providing increasing support for program evaluation" (see Chart 8, Nonprofits are planning to increase investment and use measurement and evaluation).
Despite this funding gap, two-thirds of respondents are already using performance measurement and program evaluation tools, and 92 percent said they plan to use both tools in 2015. Where does the money come from for the efforts? Several nonprofit leaders said they rely on specific funders to underwrite the cost of performance and program evaluations. In the case of Boys Town, Father Steven Boes, the national executive director, said he uses the organization's support organization, the Father Flanagan's Fund for Needy Children's income, to fund efforts to improve the quality of programs and for research. The income from this fund allows all donor dollars to be used solely toward all programs for the benefit of the children and families served by Boys Town. Other nonprofits may tap unrestricted funds, although the survey did not specifically address this question.
click image for larger view
Dennis Richardson, president and CEO at the Hillside Family of Agencies in Rochester, NY, has had success raising funds for measurement from corporate and philanthropic supporters who understand "good overhead" (e.g., training, HR, and finance systems) and value such efforts. Wegmans Food Markets is one such funder. Wegmans "is just extraordinary in how they collect and use data in a very respectful manner of their customers," Richardson said. Accordingly, the company "fully expects that we will measure what we are carrying out, and then we'll make adjustments as we go along, based on what the data tell us."
The talent conundrum: most nonprofits don't use available tools
Nearly 60 percent of respondents agreed or strongly agreed that "hiring, training, and retaining staff is one of our greatest challenges," yet many organizations do not use the tools that could assist them with this challenge. For example, only 40 percent reported using talent assessment and development tools, and just 38 percent said their organizations engage in leadership succession planning. But without talent assessment and development tools in place, employees are less likely to receive needed skill development and to feel positive about their career trajectories, both of which can lead to dissatisfaction and turnover.
Implementing these tools also requires a commitment from top leaders—including the board—to invest the necessary time in developing an organization's people and to make talent development part of an organization's day-to-day work. It should become a "part of the language," said Michael Zisser, CEO of University Settlement, a $23 million human services organization in New York.
Other organizations we interviewed also noted the positive results of focusing on talent management. Stanley Pollack said that his organization, the Center for Teen Empowerment in Boston, MA, uses the same group process for delivering feedback for both the young people in his programs and for his employees. "Creating an environment where information can flow more freely around issues of criticism and praise is really a dynamic factor in creating satisfaction among your staff," he said, adding that the organization's average staff tenure approaches 12 years.
Sister Paulette LoMonaco, executive director of Good Shepherd Services in New York City, uses a variety of tools, including the Performance-Potential Matrix and stretch assignments, to help identify potential leaders and provide them with opportunities for growing their skills. As she noted in a recent article: "An organization is only as good as the people who lead it. And the best place to cultivate those leaders often is among the talented members of your own staff. That's been our experience. But it's not enough to make leadership development a one-off affair for a select few. With the right tools in place, leadership development rises from art to science."
5. Attitudes Toward Scaling Impact Vary by Size of Organization
One of the emerging trends in the social sector involves successful nonprofits seeking to grow their impact. Knowing that, we asked several trend questions focused on specific approaches relating to the challenge of scaling impact:
- Our ultimate goal for increasing our impact is changing public policy.
- Teaching others to implement our model is a top priority for growing our impact.
- We are planning to adopt for-profit models or collaboration with corporations in the next three years to increase our impact.
- We are betting on technology innovation to increase our impact.
- We believe that collaborating with other nonprofits in our field is key to growing our impact.
- We are considering participating in pay-for-success initiatives or social impact bonds in the next three years.
- Continuing to strengthen our core offerings is more important than developing new services.
Not surprisingly, partnerships and collaboration, the top-ranked tool, also topped the list of pathways to scale, with 81 percent embracing it. This strategy appealed to nonprofits of every size and category. No other pathway even came close.
Interestingly, the second-ranked scaling trend, and the only other one endorsed by a majority of respondents (56 percent), was "focusing on core offerings versus new services." While this does not speak to a particular path to expanding scale, it is noteworthy that so many still see their futures being anchored in what they currently do best. The remaining five trends, all referencing distinctive scaling strategies, vary greatly in their support, from the 46 percent who are embracing technology down to the 19 percent who are considering social impact bonds.
The responses strongly indicate that some for growing impact strategies in the survey are best suited to large organizations. Nearly three-quarters of the largest organizations, for example, are "betting on technology innovation to increase our impact," while only 31 percent of those under $3 million said the same (see Chart 9, Larger organizations are more likely to take advantage of multiple growth pathways). Just over half of the largest organizations also said they were planning to adopt for-profit models or to collaborate with corporations to grow their impact, compared with only 35 percent of those under $3 million. The largest organizations also were more than three times as likely to be interested in pay-for-success initiatives or social impact bonds (36 percent) than organizations under $3 million (9 percent).
click image for larger view
Other strategies for growth are within reach of nonprofits of any size, but not all choose to grow. About one-third said they see either "teaching others" to use their model or advocacy—"changing public policy"—as a pathway to growing their impact. Jeremy Kohomban, president and CEO of Children's Village in New York does see his organization engaging in policy issues as a priority, but he noted that "the reason so many [nonprofits] may choose not to see public policy as a priority area is because they see themselves as vendors to government, simply providing a government-funded program rather than agents of change."
And teaching others to use your model isn't necessarily easy, even if your strategy specifically calls for it. Pollack, executive director at the Center for Teen Empowerment, said that his organization's efforts to replicate using a franchise model have been an uphill climb. "We have franchise agreements in California and Ohio in pilot right now," he said, "and it's not working all that well." Pollack noted that his organization's model for helping teens find their voice as instruments of change is complicated, and reproducing it with fidelity would require having someone from the organization in place at the franchise site on a full-time basis at least for the startup phase of the project, which hasn't been financially possible. On the other hand, Pollack said, "In addition, to our original sites in Boston, we've successfully implemented replication sites in Rochester, New York, and Somerville, MA, where we controlled implementation, used experienced staff, and had the financial and administrative support needed to fully implement the project model."
Tips for Using Tools Effectively
The survey results demonstrate that those organizations currently using management tools tend to be satisfied with their experiences. But that doesn't mean every organization should immediately run out and start using a wide range of new tools without careful thought.
When deciding what tools to implement, there are a several things to keep in mind:
- Understand your needs: Before you adopt any tool, take a careful look at your organization's most critical needs and work to align your tool choices appropriately.
- Understand the tools themselves: Tools can be highly helpful, but they can also be resource intensive, in dollars, staff time, or both. Also, recognize that some tools, such as those aimed at performance measurement and improvement, should be a core element of what you do day in and day out. Others, such as benchmarking, may be necessary only every few years to inform major strategic decisions. Learn everything you can about any tool you might use to make certain that you'll be using it effectively.
- Understand your capacities: Do you have the proper training, staffing levels, and change management processes in place to implement a new tool appropriately? Being brutally honest up front may prevent future pain or wasted effort. Also, take advantage of board members' expertise and other advisors who may have experience with some of the tools that interest you and who could provide valuable input on what effective implementation and use really requires.
Lessons from Our Inaugural Tools and Trends Survey
Our first survey confirmed the important role management tools play in service of boosting nonprofit performance, and it highlighted disconnects between managerial attitudes and actions. Nonprofits currently use a surprising number of the 25 tools we measured, and they expect to use even more. For the most part, they are happy with the results, all the more so when they devote significant time and energy to proper implementation.
Perhaps the most important message from this inaugural survey is this: pick your tools carefully to get the most out of the time, effort, and resources involved. Some, like performance measurement, should be a core part of what your organization does every day. Others offer techniques you may want to use only periodically, like benchmarking. Still others may not be right for your organization at all. It's also critical that organizations avoid overreaching. Attempting to use too many tools without adequate investment in time and resources for implementation can undermine the effectiveness of all of them. Rather than go too far, too fast, it's best to take a hard look at which tools could bring value, and focus on the few that can bring the most.
Our survey raises many questions: will nonprofits use as many tools in 2015 as they anticipate? Which emerging tools will prove most effective in the future? Which tools will fall out of favor over time? We hope to see answers unfold as we reprise this survey, and to contribute to the knowledge nonprofit leaders need to choose the best tools for their specific needs and best means to implement them for greater impact.
How We Developed Our Survey
The Bridgespan Nonprofit Management Tools and Trends 2014 survey is the result of a collaborative effort involving a panel of advisors, distribution partners, and survey analysts. Our survey is modeled on the longstanding and influential Bain & Co. Management Tools and Trends survey and was developed with the help of Bain's Advance Analytics Group.
A panel of more than two dozen sector practitioners, funders, and intermediaries, both inside and outside Bridgespan, nominated our short list of 25 tools and 21 trends from among a much more exhaustive list. The top 25 include a mix of tools both seasoned and emerging. We identified trends in a similar manner, looking both at prevailing questions in the sector as well as emergent "early signals" of attitudinal shifts.
We distributed the survey to more than 50,000 potential respondents through Bridgespan's mailing lists and social media networks as well as via the following survey distribution partners:
- The Alliance for Children and Families
- The Chronicle of Philanthropy
- Donors Forum
- Georgia Center for Nonprofits
- InsideNGO
- InterAction
- National Council of La Raza
We restricted the survey to executive-level leadership to ensure that respondents had a clear view of their organizations' tool use. We received 481 completed surveys. Our sample split by size of organization does not mirror the nonprofit sector as a whole (which tilts toward very small organizations), but the relatively consistent number of respondents from each size segment lets us create some interesting comparisons (see chart 10, Comparison of Survey Sample vs. Nonprofit Sector as a Whole).
We plan to run the survey at intervals and trace shifts over time in both tools and trends.

click image for larger view
Acknowledgements
Paul Carttar is a senior advisor to The Bridgespan Group and former director of the White House Social Innovation Fund. Chris Lindquist is Bridgespan's senior director of online knowledge and Amy Markham is a Bridgespan manager in Boston. The authors thank Thea Aguiar, Josh Grehan, Vincent McPhillip, and Julia Silverman for assistance on the survey as well as partner Katie Smith Milway for advising the project.
Bridgespan thanks the David and Lucile Packard Foundation for help funding the survey; The Chronicle of Philanthropy for early and ongoing collaboration on dissemination; and Bain & Company's Darrell Rigby, partner; Barbara Bilodeau, director of Bain's Global Advanced Analytics; and Colleen Lin, senior specialist with Global Advanced Analytics, for their help creating the survey and analyzing the results.