Hands On Atlanta was founded in 1989 to connect volunteers to service opportunities, provide nonprofit leadership training, and offer school-based direct-service programs. Today, more than 25 years in, the organization has grown from a core group of 12 committed individuals to a network of thousands of volunteers working at more than 450 service organizations and schools. But with growth comes complexity. Although Hands On Atlanta's leadership team revised its strategic plan in 2014 to reflect its focus on Atlanta's most pressing needs and potential for further growth, its senior leadership team acknowledged the need to sharpen its toolkit to implement that strategy and track progress against key goals.
To address that challenge, Hands On Atlanta signed on to participate in Leading for Impact® a program offered jointly by The Bridgespan Group and the Georgia Center for Nonprofits that provides regional nonprofit executive teams with two years of consulting support and leadership development. Members of the Hands On Atlanta team took advantage of the program to develop a management dashboard to help them track performance and ensure that the organization's efforts consistently align with its goals.
Recently, Bridgespan Manager Beth Jackson Stram, who heads up Leading For Impact—Atlanta, sat down with Gina Simpson, president and CEO of Hands On Atlanta, to talk about Simpson's experience with the program. Below, we share highlights from their conversation on developing and using a dashboard as a management tool.
What was most intimidating about getting started in creating a dashboard?
I meet other nonprofit leaders who say they can't imagine carving out the time to create a dashboard as we have done. I couldn't imagine doing it either, at the beginning. It is hard to get started, because it means making difficult choices about some of the things that you're not going to pay as close attention to, and maybe you've been measuring those things for a long time. But the point of the dashboard is to focus on the things that matter most—the metrics you need to see in order to assess your goals, and your progress against your goals. For those leaders reluctant to start, I say, dive in and do it. At first, you will be overwhelmed, but you will learn quickly from your mistakes. In nonprofit work, we're so busy that sometimes the good—the work that we do on a daily basis—gets in the way of the great—the extra effort it takes to be purposeful and strategic about long-term goals. You work very hard, but you don't necessarily work productively.
What Is a Dashboard?
A dashboard tracks the vital few metrics that your organization needs to monitor in order to understand and manage its performance. While program and functional staff often track dozens of indicators to understand whether their work is on track, the best dashboards for senior leadership typically focus on the vital few metrics across those units that keep the executive director up at night and are critical to entire organization's success.
It is worth the extra time and effort to create a dashboard. This work has brought so much transparency and clarity to our leadership team. Our conversations with the board, and with each other, are more strategic, more useful. We can keep the full board meetings focused on strategy, and get into the more tactical issues in subcommittee work.
What was your primary purpose for creating it?
We wanted a tool that would enable us to have accountability to ourselves and to our board, and we found that it made a difference right away. After looking at our earliest rounds of dashboard data, for example, we were compelled to revise our budget. The dashboard helped us understand that launching a new strategy was going to take a lot longer than planned. It helped us adjust to reality and have that conversation with the board, so we didn't end the year in a hardship.
How should a leadership team approach deciding how much and what to track?
From the senior leadership team view, 15-20 things to measure seem manageable. We have limited time and if we are not focused on our key priorities, we are less likely to reach our goals. More than 20 metrics and you will be spreading yourselves too thin, or getting into areas that program and functional staff should be focusing on. If you take the dashboard approach across your organization, you will have other staff members tracking additional metrics at the program level.
Don't worry about it being perfect. Over time, you'll drop some metrics off, and you will add others. For example, we initially left off some metrics around professional development, retention, and employee satisfaction, and soon realized they were important.
Make sure, though, that if you add a metric to your dashboard, you take one off. That's hard to do, but it's necessary. For example, we want to make sure that board members' ownership and accountability are part of the dashboard, but we may have too many metrics there, and so we'll have to wrestle with it.
How has the dashboard been most useful?
The dashboard has been very useful in engaging the board in strategic planning and decision making for our programmatic and fund development efforts. For example, we had an unsuccessful initial launch of our teen service programs. Two key metrics on our dashboard, one for the teen program and one for our family service program, helped us drive a discussion with the board. We weighed whether to focus less on teen service and invest more in our family service program, which was highly successful or to further examine what would make our teen service programs as successful. In the end, we decided to hold focus groups and to restructure our programs in order to make the teen programs successful. Utilizing the information gathered from teens and parents during the focus group conversations, we successfully re-launched the programs this summer.
How often do you update your dashboard?
We update ours monthly, and we have a series of conversations around it—first internally, then with board committees, and finally with the full board on a quarterly basis. We produce more detailed reports for our subcommittees, and then roll it all up into more of a summary type of dashboard for the board.
That summary cuts across several elements of our organization and provides a full, high-level view of our volunteers, our marketing, our donor engagement, and our financials and impact overall. We set targets for each metric, so we can see if we are on track.
What have been the biggest benefits to having a dashboard?
There are no end-of-year surprises! The data tells us things we wouldn't have seen before.
For example, by tracking tutor hours, we found that schools weren't using our mentors appropriately. Students weren't getting the tutoring hours we know they need because the mentors were getting pulled away to do other things during the school day. But we know that consistent tutoring hours are critical to having students make progress, and so we did an intervention with our schools and addressed the problem. Our dashboard helped us home in on what mattered most, allowing us to keep discussions more high level and enable us to see and focus on the most critical issues.
Another example: the dashboard reports helped us spot a lull in our numbers in our family services program. Subsequently, we tweaked the marketing associated with that program, and now we're getting the numbers we want.
Most important, data, relevant data, is now driving our conversations. This has been a culture change and has become a way of life. The people who won't take the time to create a dashboard often see it as a daunting process. But they don't see how it will simplify their lives. The consensus building among board members and staff as a result of reflecting together regularly on the dashboard has fostered greater commitment, trust, and understanding of our organizational efforts. This has given us wings to soar.
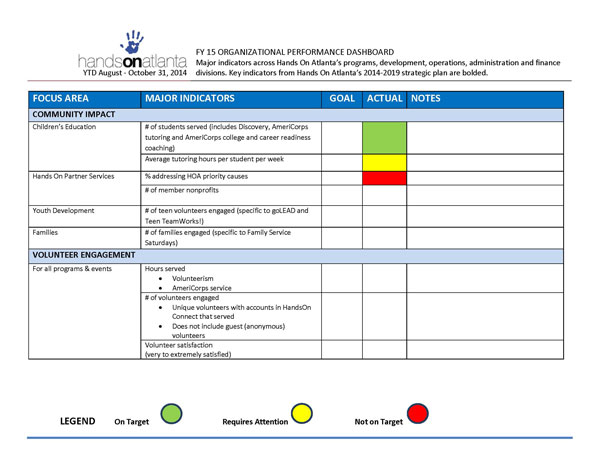
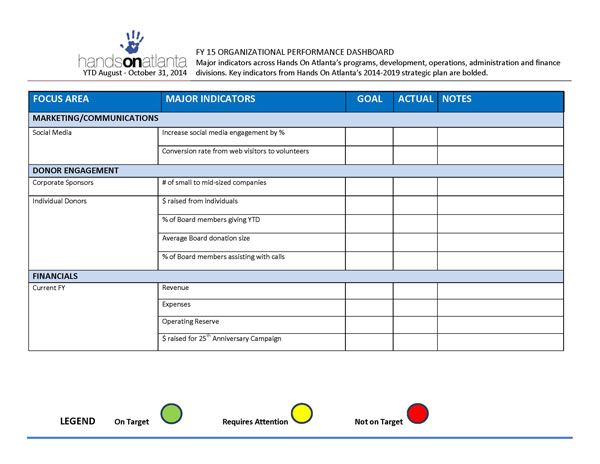
Hands On Atlanta's Dashboard