Next In: Preparing to Grow Your Network's Impact
-
Start with Strategy: Use the network’s unified strategy to drive decision making
-
Diagnose Performance: Diagnose where the network is today and uncover pockets of strength
-
Facilitate Learning: Use diagnostic results to facilitate learning and improvement
Overview
Where is the network currently, on the developmental pathway?
As you identify and agree on your network’s developmental stages, you can start to locate where affiliates fall today on the developmental continuum. These data and findings can be used to build a deep understanding of where the relative strengths and weaknesses are across affiliates, and help set up individual affiliates—and the network as a whole—for improvement. Networks often find that this analysis also reveals previously hidden success stories.
Gather and analyze data
Gathering data
The best data gathering system/approach will be repeatable, so your network can measure affiliate progress over time. Take the opportunity, as necessary, to be resourceful about how to gather relevant data across the different dimensions without overtaxing the people involved (who are in all likelihood balancing this work with their regular day-to-day obligations).
(Having consistent and reliable data across your network is key to the five elements approach, but there is an added benefit as well: an increased ability to show funders and other stakeholders that the network is focused on outcomes.)
Many networks use both top-down data gathering and bottom-up self-assessment approaches; some might rely mostly or completely on one approach or the other.
Related Content
For top-down data gathering, the center owns the data collection and aggregation process, and may use data they already have, or use their systems to generate data.
For the bottom-up approach, affiliates own the data collection process, and may share some or all data with the center. Bottom up approaches may lend themselves more to Five Elements processes in which affiliates will self-select into services and supports, rather than those in which the network will determine affiliate stages and determine into which band of services affiliates will receive.
In any case, demonstrating how the process will help affiliates make data-gathering easier.
Case Study: ChalleNGe
Consider the experience of the National Guard Youth Challenge Program (ChalleNGe), a federated network. ChalleNGe offers a quasi-military environment for teens that have dropped out of secondary school, with the aim of helping them become productive citizens. Each of the 33 affiliates offers essentially the same two-part program. Read more>>
Analyzing data
After gathering the data, use the data and the developmental stages your network has identified to map where affiliates fall. You will want to do this by individual dimension, as well as for the overall affiliate stage groups. For an example based on an individual dimension, please see the chart "Programmatic Dimension Groups," below.
Programmatic Dimensions Groups
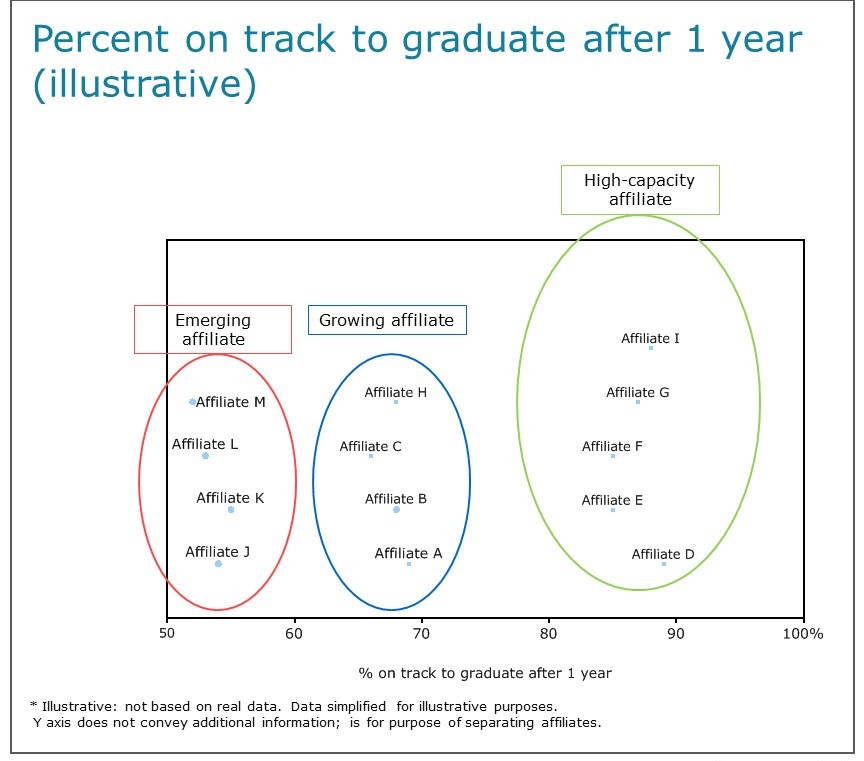
Download a PowerPoint copy of "Programmatic Dimension Groups."
Case Study: Big Brothers Big Sisters of America
Consider the experience of Big Brothers Big Sisters (BBBS). BBBS, the nation's largest youth mentoring program, has worked since 1904 to provide children with positive adult role models through one-to-one matches. While revising its strategic plan in 2010, the organization's leaders determined that they wanted to refine the way the network measured and improved performance. Read more>>
Make adjustments if needed
Ideally, for the overall affiliate stage groups, affiliates would cluster into relatively neat groupings, and the developmental stages would be clear—and aligned with your network’s early hypotheses. This might not always be true, however. For any given dimension, your network will need to find the approach that works best; in some cases this might be identifying natural clusters. In other cases, this might be choosing specific data-driven lines to separate groups. It is often hard to know what’s best until you start looking at the data, so be prepared to make adjustments as needed.