Executive Summary
Although funding is a pressing concern for nonprofit organizations across the United States, detailed information about how dollars flow within the sector is hard to come by. For example, are there distinct patterns to the ways in which nonprofit organizations are funded? If the answer to this question is “yes,” those patterns could provide important “guideposts” for similar organizations planning their fund development strategies.
To begin answering this question, The Bridgespan Group researched the funding for three samples of nonprofit organizations using Form 990 returns, complemented by company-specific reports and personal interviews. Our initial sample was drawn from the largest organizations in a variety of fields. The goal here was to explore whether there were patterns among large, financially sustainable nonprofits. We then focused on organizations from two of those fields—youth services and environmental advocacy—so that we could compare the funding of similar organizations of different sizes. In each case, we relied on the National Taxonomy of Exempt Entities (NTEE) classification system to populate the sample.*
Key findings include:
- The largest organizations tend to rely on a single type of funding for the majority of their revenue, rather than having a balanced mix from a variety of funders. Among youth services and environmental advocacy organizations, there are distinct transition points across a spectrum of revenue sizes where organizations move from heterogeneous to single type funding.
- Among the largest organizations, the kind of work an organization does influences, but does not dictate, the identity of its dominant funding type.
- In the fields we selected for in-depth analysis—youth services and environmental advocacy—growth to a significant size is extremely rare, and the largest organizations control most of the resources.
- In youth services and environmental advocacy, there seem to be transition points in the typical funding mix used by organizations of different sizes, suggesting that the size of an organization influences its dominant funding type.
- In environmental advocacy, foundations and individuals provide most of the funding, and the funding composition of the top 50 organizations is stable over time.
- In youth services, government funding is a more significant part of the funding mix for larger organizations—apart from the organizations above $100 million, which tend to rely on individual funding.
- In both youth services and environmental advocacy, foundation funding is an important type of funding for small organizations (less than $1 million), but it becomes a small part of the funding mix for large organizations (greater than $10-25 million).
Our research raises several important questions. Chief among them: How much does an organization’s field influence the types of funding available to it? What is the role of foundations in transitioning grantees onto other funding types? What are the potential benefits of partnership with a larger organization? And, finally, how important is an organization’s brand when it comes to accessing certain types of funding?
How Did We Come To This Research?
The Bridgespan Group is a 501(c)(3) nonprofit organization that provides strategy consulting services to nonprofit organizations and foundations. We also have an active knowledge sharing strategy, which includes conducting additional research to complement what we learn from our consulting engagements. We share the resulting knowledge with the broader nonprofit community.
Over the last three years, we have helped nonprofit organizations develop and implement strategies for deepening and broadening their impact on society. In doing so, the question of funding has always been a concern; yet we have found that while many organizations exist to help execute funding campaigns, there is little guidance or information available to help nonprofit leaders think strategically about fund development.
It has become clear to us that nonprofit organizations would value guideposts to direct their fund development strategies. One key guidepost would be in-depth knowledge of “typical funding patterns” for organizations engaged in similar activities. (Smaller organizations planning to grow, for example, could draw on the experience of larger peers to inform their own funding options.) There is an apparent absence of this kind of information in a readily accessible and sufficiently detailed format.
This project is a preliminary exploration of how funding patterns are related to the size of organizations, with a focus on youth services and environmental advocacy (two fields with which Bridgespan has been particularly involved).
Funding Patterns: The Data Dilemma
There is a significant amount of information available about funding sources, including: trends in funding patterns over time;[1], [2], [3], [4] comparisons of patterns between different fields;[5], [6] international patterns;[7] and patterns in the largest organizations.[8] However, this information is typically presented in the form of averages and does not include details of how funding differs among organizations of different sizes within the same field. As a result, the data is of limited utility for individual organizations seeking guideposts for their fund development strategies.
There are two main reasons for this gap: first, the absence of widely accepted mechanisms for sorting nonprofits into fields; and second, the rules for reporting revenue sources to the IRS.[9] For example, the IRS Form 990, required of all charitable organizations larger than $25,000, does not separate corporate, foundation, and individual donations. Instead, it includes them all under “public support.”[10]
More granular information about funding patterns is likely to help nonprofit organizations plan realistic growth and fund development strategies. Our experience working with foundations on their grant-making strategies suggests that such information would also be valuable for funders trying to maximize the impact of the dollars they spend in particular domains. More detailed information could also shed light on the flow of funds in the nonprofit sector, and suggest how this flow of funds affects the activities and behavior of nonprofit organizations.[2], [11]
Initial Questions
For the largest organizations:
- Are the sources of funding for large, financially sustainable nonprofit organizations idiosyncratic, or are there predictable patterns based on the characteristics of the organizations. Specifically, do particular fields attract certain types of funding?
For youth services and environmental advocacy organizations:
- How common is it for organizations engaged in these activities to achieve significant scale?
- What are their dominant types of funding and how do these differ among organizations of different sizes?
Research Methods and Sources of Data
Analysis of large organizations
We focused on seven categories of nonprofits that are representative of Bridgespan’s clients (Figure A), and identified the top 10 organizations in each field using the Nonprofit Times Top 100 database [7] and the National Center for Charitable Statistics (NCCS) database of Form 990 returns.[12] (See Appendix A for a list of these organizations.) Of these, we selected a sample of 30 organizations and used interviews and company-specific reports to categorize their annual funding into six types of funding: individuals, corporate, foundation, investments, private fee for service, and government (Figure B).
Environmental advocacy and youth services organizations
We defined “environmental advocacy” and “youth service” using National Taxonomy of Exempt Entities (NTEE) classifications[13] (see Appendix B for details), and then used the NCCS database to map how many of the organizations in each field fell into specific revenue classes and what proportion of total funding each of those classes accounted for. We then selected a sample of organizations from each revenue class (see Appendix C for a list of the sample organizations) and sorted the funding for this sample into the six funding types using interviews, annual reports, and public data.[14]
Key Findings
The largest organizations tend to rely on a single type of funding for the majority of their revenue, rather than having a balanced mix from a variety of funders. Among youth services and environmental advocacy organizations, there are distinct transition points across a spectrum of revenue sizes where organizations move from heterogeneous to single-type funding.
We selected 30 organizations as a sample of the largest organizations across the nonprofit sector. Of these, 27 relied on a single type of funding for more than 50% of their revenues (Figure 1a). On average, that source accounted for 78% of revenues. This pattern suggests that focus on a single funding type is important for an organization that wants to grow to significant scale. Organizations are unlikely to achieve significant scale with a balanced mix of government, corporate, individual, and foundation funding. This finding is supported by our analysis of environmental advocacy and youth services organizations; environmental advocacy organizations above $10 million are likely to have a dominant funding source (Figure 1b), as are youth services organizations larger than $3 million (Figure 1c).
Among the largest organizations, the kind of work an organization does influences, but does not dictate, the identity of its dominant funding type.
In dividing the sample organizations into fields, we used their NTEE classification. Each combination included only a few organizations; however, the results suggest that there may be one or two “most likely” funding types (Figure 2); none of the organizations were completely dominated by a single funding type. This finding suggests that studying the funding types used by the largest organizations can provide other nonprofits with a guide to the “menu options” they have in growing to significant scale. For example it may be that private and government fee-for-service are the best options for organizations trying to achieve significant scale in the economic service provider field.
The vast majority of organizations in both youth services and environmental advocacy have revenues of less than $1 million (Figure 3a), and a small number of large organizations receive the majority of funding (Figure 3b). For example in youth services, about 400 organizations (2% of the total number) control 50% of the resources. This is significant in the context of this research because it suggests that it is exceptional for organizations in these categories to reach significant scale. This finding serves to highlight the need for a purposeful approach to fund development for organizations that are trying to grow to scale. In the areas we selected for in-depth analysis—youth services and environmental advocacy—growth to a significant size is extremely rare, and the largest organizations control most of the resources.
Among youth services and environmental advocacy nonprofits, there seem to be transition points in the typical funding mix used by organizations of different sizes, suggesting that the size of an organization influences its dominant funding type.
In environmental advocacy, individuals and foundations provide most of the funding, and the composition of the top 50 organizations is stable over time.
The dominance of individual and foundation funding in this field (Figures 4a and 4b) is not surprising given the role of these organizations in delivering public benefits, and their often adversarial position with governments and corporations. We also found that the 50 largest environmental advocacy organizations (greater than $11 million in 2001) receive about 60% of total funding in the field, and they make up a stable group. (Also, 60% of the top 50 largest organizations in 2001 were also in the top 50 in 1991.) In environmental advocacy, then, it seems that growth to significant scale is likely to be driven by individual contributions. The apparent diversity of funding sources in the $3-10 million class is a pattern that may warrant further research with a larger sample, since it suggests that organizations are diversifying fund development strategies in order to grow at this scale.
In youth services, government funding is a more significant part of the funding mix for larger organizations—apart from those above $100 million, which tend to rely on individual funding.
Youth services organizations have a greater diversity of funding sources than environmental advocacy organizations, and funding is generally dominated by foundation, government and individual sources (Figures 4c and 4d). The relative contribution from government increases with organizational size, and is greatest for the $25-100 million size range, when, on average, it accounts for more than 80% of the revenues for our sample (Figure 4e). However, the largest organizations (greater than $100 million) receive little funding from government, and tend to rely on individuals (Figure 4f).
There seem to be a number of differences between the organizations in the $25- 100 million class and those in the largest class, particularly geographic coverage, type of service provided, age and level of public name recognition. It is likely that these factors have an influence on funding type and also on the ‘optimum’ scale for the organization; these factors may be interacting to create this pattern.
Foundations are an important source of funding for small organizations (less than $1 million), but this source becomes a small percentage of the funding mix for large organizations (greater than $10 million for environmental advocacy, and greater than $25 million for youth services.)
In both youth services and environmental advocacy, foundation funding as a percentage of revenue is lower in larger organizations (Figures 4g and 4h). This finding suggests that organizations looking to grow should be considering ways to diversify their funding away from foundations over time.
Actionable insights for organizations trying to grow to scale
Growth isn’t a “given”: Very few organizations achieve significant scale, so it is unlikely that nonprofits will substantially grow revenues without a purposeful approach to fund development.
- Expect to focus with growth: Most large organizations have one type of funding providing more than half of their income. This means that as nonprofits grow to significant scale, similar focus will be the best strategy— and investing in the organizational capacity to raise funds from the dominant type will likely be necessary.
- Plan on diversifying away from foundation funding: Foundation funding is a smaller part of the funding mix for larger organizations—so in planning a growth strategy, identifying and pursuing funding sources to augment current foundation monies is likely to be important.
- Benchmark similar organizations for funding guideposts: There are patterns in funding types, and understanding these patterns will help nonprofits plan their fund development strategies. Benchmarking similar, larger organizations can provide a guide to the menu of available funding options.
Concluding Ideas and Questions
Given the small sample size and restricted sector coverage of this study, we can not draw broad conclusions from the data. However, the results have sparked a number of ideas and questions within the Bridgespan Group, which we would like to share here.
Why are large organizations typically focused on one type of funder?
Among a diverse sample of 30 large organizations, we found that 90% relied on one type of funding for more than half of their revenues. The idea that large organizations generally would rely on one funding type to provide the majority of their revenue makes sense for two reasons. First, we have also shown that the activities in which the organization engages will influence the set of choices available, so it would be logical to focus on one of the most suitable funding types. Second, there are key management and fund development skill-sets associated with each of the funding types, and therefore focusing on and developing expertise in a core set of skills would be predicted to provide the best overall return. For example, Froelich points out that government agencies are likely to require more formalized and standardized documentation, evaluation and accountability than other sources of revenue. [9]
This finding should not be overstated, since smaller sources beyond the organization’s dominant type could be valuable as a source of unrestricted operating funding or as a way to hedge against revenue volatility over time. In addition, this analysis does not include variation within each funding type; for example, individual contributions could encompass a large number of donors of different types as well as membership fees and special-events revenue.
How important is “brand value” in accessing certain types of funding?
This study found that the largest organizations in youth services and environmental advocacy tend to be funded predominantly by individual donations and membership. These organizations are generally well established and very well known at a national level, which suggests that their public ‘brand value’ is important in raising money from individuals. The importance of brand could be good or bad news for small to medium-sized organizations that want to grow to a large size, depending on what is driving the brand value. If brand value is driven by the fact that these organizations are old and well established, then it will be very challenging for young organizations to make the leap to substantial individual funding. However, the experience of a few of the organizations we’ve observed, such as the National Wild Turkey Federation and the Make a Wish Foundation, suggest that it is possible to establish a national brand even if you are a relatively young organization. Other examples of non-profit and for-profit companies that have been able to build their brands quickly in a cost effective manner could also be illuminating for nonprofits.
Given how difficult it is to grow, how much emphasis should smaller nonprofits place on working with larger nonprofits?
We identified a steep decline in the number of organizations as size increases, which suggests that growth is very challenging for nonprofits. This suggests that in the right circumstances, small to medium-sized organizations may benefit from a focus on driving impact through partnerships with larger organizations and networks, rather than through organizational growth. This question warrants further research.
How could knowledge about funding patterns help funders maximize the impact of their grants?
We expect that better knowledge about funding patterns in the nonprofit sector will benefit foundations and other funders looking to maximize the impact of their charitable donations. For example, the preliminary findings in this study highlight the fact that foundation contributions decline as a percentage of total funding in larger organizations, but are still significant—they increase as an absolute amount. How are foundations changing their grant-making strategy for organizations of increasing size? Is there a shift away from program support to capacity building? Does capacity-building support help nonprofits develop capability to raise funds in a large scale fashion?
What is the role of individual funding in giving an organization political legitimacy, and why are some fields able to attract lots of individual funders?
Individual funding is the dominant model for the largest environmental advocacy organizations sampled, and these typically have large membership bases (e.g. NRDC, which has more than 500,000 individual members), which means they have legitimacy as advocates representing a significant public constituency. [2], [9] This is not the case for the large youth services organizations, which are individually funded but do not have large membership bases. Smaller numbers of individual contributors may affect the perception of the organizations’ legitimacy and their influence as advocacy organizations. This observation raises two questions: First, is it the amount given by individual contributions or the number of individual contributors that drives political legitimacy? Our hypothesis would be the latter. Second, how important is an organization’s field in constraining the available funding options? Could a youth services organization ever achieve a membership base similar to that of an environmental advocacy organization and benefit from the clout such a base would give them?
How do funding types influence the activities and operations of nonprofit organizations?
Better knowledge of funding patterns is likely to provide interesting insights into the operation of the nonprofit sector, because funding type influences the activities and operation of nonprofit organizations. [9] For example, organizations relying on foundations to provide most of their funding may be more vulnerable to “goal displacement” or “mission drift,” as they adapt programs to match foundation priorities. Government-funded organizations, for their part, tend to be much more restricted in the use of their funds.[9] All funding sources influence activities and operations in one way or another, so gaining a better understanding of the flow of these sources is an important objective.
What are the limits to using benchmarks or “typical patterns” of funding as guideposts for organizations planning fund development strategies?
Variables that will influence both funding patterns and “optimum” size (e.g., age of organization, geographic coverage, detailed activities, and affiliate or non-affiliate structure) exist within every nonprofit category. As a result, it may be possible to define important sub-categories within any particular one. An example of this is in youth services, where it seems that the $25-100 million group differs from the greater than $100 million group (younger, regional rather than national, different types of services delivered). These differences are likely to affect the optimum size and appropriate funding types—and probably explain the pattern in government and individual funding in these two size groups. The definition of field, then, is critical for organizations looking to benchmark similar organizations—the greater degree of similarity in these other variables, the better.
What questions do these findings raise for further research?
Expanding the sample sizes and fields covered in this research could be a useful approach for further research aimed at providing guideposts for nonprofit organizations and funders. One key challenge is balancing the level of detail in the definition of fields, to ensure that organizations are able to compare like with like (by controlling geography, activity, age), without creating a never-ending list. It is also likely that an analysis of “growth stories” from organizations that have been able to achieve significant growth will provide some more generalize-able insights into effective fund development strategies and the characteristics of nonprofits that are able to achieve significant growth.
Appendix A: Largest nonprofit organizations by field
The names of organizations that were included in our sample are bolded.
Appendix B: NTEE classifications for youth services and environmental advocacy
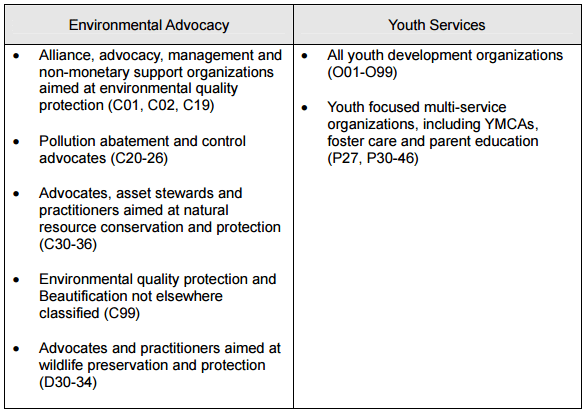
* The National Taxonomy of Exempt Entities was developed by the National Center of Charitable Statistics to facilitate the collection and analysis of data from tax-exempt nonprofit organizations. The NTEE classification system divides the broad universe of nonprofit organizations into 26 major groupings (such as health, education, and youth services), which are further subdivided by specific activity areas (such as advocacy and service provider). For simplicity, we have used the term “field” to describe these classes throughout the paper.
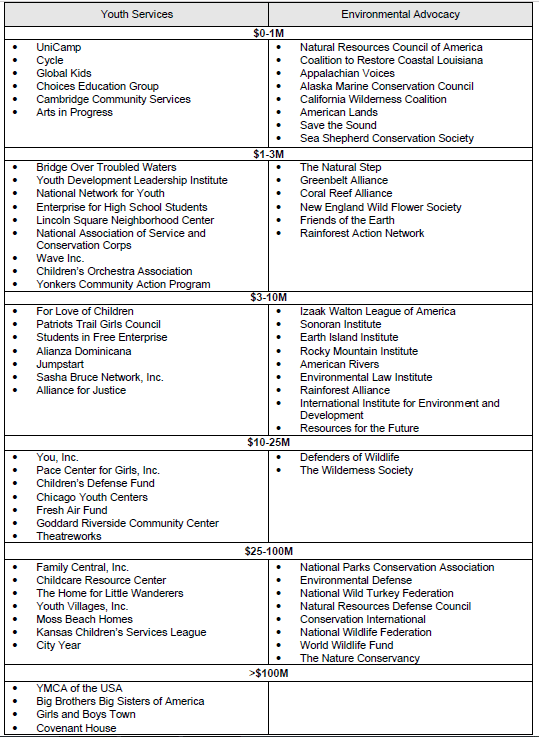
Appendix C: List of sample youth services and environmental advocacy organizations
List of sample youth services and environmental organizations
Sources Used for This Article
[1] Johns Hopkins University Institute for Policy Studies (2003). Listening Post Project Communique No.1. [online at http://www.jhu.edu/listeningpost/news/]
[2] Dobkin Hall, P. and Burke, C.B. (2002) Historical Statistics of the United States Chapter in Voluntary, Nonprofit, and Religious Entities and Activities: Underlying Concepts, Concerns and Opportunities. Hauser Center for Nonprofit Organizations Working Paper No.14. Hauser Center, JFK School of Government, Harvard University [online at http://www.ksg.harvard.edu/hauser/publications/working_papers/workingpaperlist.h tm]
[3] Salamon, L.M. (ed.) The State of Nonprofit America. Brookings Institution Press, Washington DC.
[4] Boris, E.T. (1998) Myths about the Nonprofit Sector. Charting Civil Society Series, Urban Institute
[5] Independent Sector (2003). The New Nonprofit Almanac and Desk Reference. John Wiley & Sons, New York.
[6] Salamon, L.M. (1999) America’s Nonprofit Sector: A Primer (Second Edition). The Foundation Center.
[7] Salamon, L.M., and Anheier, H.K. (1994). The Emerging Sector: An Overview. The John Hopkins University Institute for Policy Studies, Baltimore.
[8] Nonprofit Times (2003). Nonprofit Times 100. [online at http://www.nptimes.com/Nov02/sr1.html].
[9] Froelich, K.A., Knoepfle, T.W., and Pollak, T.H. (2000). Financial measures in nonprofit organization research: Comparing IRS 990 return and audited financial statement data.” Nonprofit and Voluntary Sector Quarterly. June 2000
[10] Department of the Treasury Inland Revenue Service (2002). Instructions for Form 990 and Form 990-EZ. [online at www.irs.gov/pub/irs-pdf/f990.pdf]
[11] Froelich, K.A. (1999). “Diversification of revenue strategies: Evolving resource dependence in nonprofit organizations.” Nonprofit and Voluntary Sector Quarterly, September 1999.
[12] National Center for Charitable Statistics (2003). Database of Form 990 returns.
[13] Guidestar (2003). NTEE Classification System. [online at http://www.guidestar.org/npo/ntee.stm]
[14] Foundation for Public Affairs and Congressional Quarterly Inc (2002). Public Interest Profiles 2001-2002. Congressional Quarterly Books, Washington DC.