Many development leaders of network nonprofits want to know which of their sites are performing well at fundraising, but it can be hard to compare sites because the communities they fundraise from are different. Share of wallet, an analytical tool used for decades in the private sector, can be adapted to network nonprofits—putting each site's fundraising into the context of the community that supports it. This guide accompanies The Bridgespan Group's article "Helping Nonprofit Networks Strengthen Their Fundraising Effectiveness," which explains share of wallet in greater detail.
This guide also is a companion to Bridgespan's Share-of-Wallet Analysis Tool Template and explains how to use the template to produce your own analysis.
Download the TemplateUsing the Share-of-Wallet Analysis Template
Anything you should do in the Share-of-Wallet Analysis Template will be noted with a blue bar. Before getting started, get acquainted with the template layout below:
The green tab contains orientation instructions.
(1) START HERE
Explains how to use the model.
Blue tabs require inputs from you about your network.
(2) INPUT-Sites and Revenue
Enter the names of your network's sites and their revenues for the fundraising streams you decide to include.
(3) INPUT-Site Zip Codes
Enter the zip codes assigned to each of your network's sites. (Your sites' names will be pulled automatically from the prior tab.)
Orange tabs contain the share-of-wallet analysis output. You will only need to make minor changes to complete your analysis.
(4) ANALYSIS-Revenue Potential
Contains an analysis of the revenue potential for each site, across each revenue stream.
(5) ANALYSIS-SOW Performance
Contains more detailed analysis, including the performance ranks for each site across each revenue stream.
Gray tabs contain calculations performed by the model, as well as background data. Do not modify these tabs.
CALCULATIONS-Site Area Income
Contains calculations of the total income in each site's catchment area. Do not modify this tab.
CALCULATIONS-SOW Output
Contains tabular share of wallet—the same information is presented more clearly on the orange tabs. Do not modify this tab.
RAW DATA-Income Estimates
Contains the US Census Bureau's estimated income for every zip code in the United States.
Some areas of the template—including the gray tabs—are password protected to ensure the integrity of the formulas. More information is available in the Appendix at the end of this document.
The text is also color-coded to make navigation simpler. Within the tabs, you will see:
Example
Cells with blue text indicate where you need to add information about your network.
Example
Cells with black text contain formulas or data that are part of the model. Don't change them.
You will also find boxes with longer sets of instructions, which are written in red. You can drag and drop these boxes if they're in the way.
Once you are familiar with the template, you can begin the analysis.
Some cells and tabs of the template are password protected to ensure the integrity of the formulas. Specifically, all three gray tabs and the site names on (3) INPUT-Site Zip Codes are password protected.
You do not need to unlock the spreadsheet to complete a share-of-wallet analysis. Best practice is to leave the protections intact.
However, if you want to unlock the spreadsheet for any reason, you can click on the Review menu and select "Unprotect Sheet." The password for any locked area of the spreadsheet is the word revenue in lower-case.
Assembling Your Share-of-Wallet Analysis
Step 1. Identify Which Categories to Analyze within Individual Giving
Use care when choosing the categories of revenue data that you feed into this analysis, as your choices will determine the meaning of the analysis. The choices you make will determine whether you can learn anything meaningful from the analysis. Four rules will help point you toward the right data:
- To include a revenue stream, you need complete data about each site. The analysis compares sites to one another and requires complete data.
- Include only revenue streams where the dollars come from individuals. Think direct mail, major gifts, galas, and even, in the case of The Salvation Army, the famous red kettles.
- Include only data that you're confident is comparable across sites. For example, if you're not sure whether your sites are consistent in categorizing incoming dollars between fundraising events and board donations, but you're sure they're from one or the other, you could combine those two revenue streams.
- Make sure the revenue streams don't overlap. Notice that for our example nonprofit we're performing three analyses for the separate revenue streams. We're not performing a fourth analysis on "total revenue" because these three streams would be part of that overall revenue stream. But if you only have numbers for total revenue, a combined, single analysis is still a great place to start.
Make a note of the funding categories you're planning to analyze and move on to Step 2.
Step 2. Collect Multiple Years of Fundraising Data
In order to rule out outlier scenarios, such as one really large gift or a leadership change for a certain site, it's important to run share-of-wallet analyses on a few consecutive years of revenue data.
That said, to learn about your sites' effective practices, you must be using relatively recent data. The Share-of-Wallet Analysis Template is built to handle revenue data from no earlier than 2010—ergo only include data from 2010 or later.
Important: We suggest collecting all the network data (revenues, zip codes, etc.) that you need for the site analysis in a separate Excel file so that you can copy-paste it into the Share-of-Wallet Analysis Template carefully and all at once.. You want to avoid making any changes to the data after you add it to the Share-of-Wallet Analysis Template.
In a separate Excel file, collect a few years of data (from 2010 or later) for the funding categories you identified in Step 1. You want the revenue data in your separate file to be organized just like the Share-of-Wallet Analysis Template (see tab called (2) INPUT-Sites and Revenue):
 INPUT Sites and Revenues Tab")
Keep each year of revenue data in its own tab—in order to create fully separate analyses for each year later.
Step 3. Segment Sites into Logical Groupings
Other Ways To Segment Sites
Segmenting sites by revenue is an intuitive and straightforward way to move forward comparing similar sites. But a different segmentation might make more sense for your organization—understanding each network's context is critical.
Another common way to segment sites is by the size of the community's population. For example, the cities shown for our sample nonprofit could be separated by very large cities, such as New York, from smaller ones, such as Tulsa.
Staffing is another way to segment. One network development leader we spoke to said that a major factor for her sites was whether or not they employed a full-time development professional. For her, it makes the most sense to segment sites that have a development professional from those that don't.
Comparing similar sites to one another is important. If your network already has an established way of grouping sites for comparison, you should use that segmentation. If you don't already have an established segmentation, segment your sites by revenue.
There's no single formula for revenue segments that applies to all networks, but there are three guidelines:
- Look for big gaps between sites' revenues—these may suggest that the sites operate very differently.
- Be sure there are at least three or four sites in even the smallest segments—otherwise, you can't learn much from the data.
- Always keep in mind why you're segmenting the sites—if New York City won't believe that the same lessons apply to Buffalo, the two should probably be segmented from each other.
The example nonprofit in our template has six sites with total revenue greater than $3 million, while the other eight top out at $2.2 million. We would segment the six bigger sites from the eight smaller ones.
Make a note of your segmentation. You will want to run the analysis for your full set of sites first, and then create separate analyses for the segments if you feel it's necessary.
Step 4: Identify Boundaries of Services Areas
Calculating each site's share of wallet hinges on understanding the resources of the communities from which your sites fundraise. It's important to realistically define the area where you can expect most of each site's fundraising dollars to originate. This requires a judgment call. Three guidelines apply:
- Site boundaries should capture most of the dollars that a site could expect to raise, but without casting an unreasonably wide net. It's important to strike a balance.
- Different sites' boundaries should not overlap. To avoid double counting, each site should have a clear boundary.
- Not all sites boundaries need to be defined the same way.—An urban site in a densely populated area, for example, might have a smaller service area than a rural site.
If your network has already defined the zip codes that are assigned to each site, use that list. For networks that don't have defined site boundaries, the simplest approach is to draw a radius around each site's headquarters.
Once you have established a reasonable fundraising radius, you need to find all the zip codes within your sites' catchment areas.
As with the revenue data, you want to collect this data on a tab of the separate Excel file. Your zip codes should be organized just like the (3) INPUT-Site Zip Codes tab of the template. The site names run across the top (in the same order from tab 2) with all the zip codes for each site running down the column below it.
- Start on the zip code tab of the template (called (3) INPUT-Site Zip Codes). Copy the sites names from Row 1 and paste them into your separate spreadsheet (using Paste Special > Values).
- Navigate in your browser to: http://www.freemaptools.com/find-zip-codes-inside-radius.htm.
- Conduct a search for your first site by entering the appropriate radius and the site's home zip code. Click "Draw Radius." Next, click "Toggle CSV or New Line" so each zip code appears on a new line, as in the template. (Leaving the zip codes as comma separated values, or CSV data, would be more complicated because you would have to remove the commas.)

- Copy the zip codes and paste them into your first site's column (Column A) on the separate spreadsheet. Be sure to double-check that all the zip codes were included, in case your computer copies only a portion of the output.
- Repeat the process for all sites in the network. This list of sites' zip codes can be useful for segmenting sites in the future.
Step 5: Based on Income, Calculate Share-of-Wallet
Now it's time to add your network's data to the Share-of-Wallet Analysis Template. Throughout this step, best practice is to paste using Paste Special > Values, so that the content is pasted in, but any formatting is left out. And refrain from changing the data once you add it to the template.
Revenue data: Since you organized the revenue data in your separate Excel file like the (2) INPUT-Sites and Revenue tab, you can copy and paste it in place of the example data.
- In the tab (2) of the template, delete the example site names and revenue numbers by selecting them, right clicking, and choosing "Clear contents."
- Copy the site names and revenue data from your separate file and paste them into the template (using Paste Special > Values). Because the template contains complex calculations, you may find that your computer slows.
Zip code data: Again, since you organized your zip codes like the (3) INPUT-Site Zip Codes tab, you can copy and paste to replace the sample data.
- In tab (3) of the template, delete the example zip codes by selecting them, right clicking, and choosing "Clear contents." You will not be able to delete the site names displaced on tab 3—the template pulls your site names from tab 2.
- Double-check that your sites are in the same order in your separate file as they are in the template. Copy all the zip codes (not the site names) from your separate spreadsheet and paste them into the template (using Paste Special > Values). Again, it is normal for your computer to slow down at this point.
The other piece of data you need in order to calculate share of wallet is the income pool that each site is drawing from—the total income in the communities established during Step 4. The Share-of-Wallet Analysis Template includes the US Census Bureau's estimates of income and population for every zip code in the country (from the Bureau's American FactFinder database), so estimates of each site's income are calculated automatically. (They appear on the tab called CALCULATIONS-Site Area Income.)
The Share-of-Wallet Analysis Template automatically pulls together the key data points for every site—fundraising revenue and community income—to calculate two metrics for each revenue stream:
- Share of Wallet: Each site's fundraising total from a particular revenue stream, divided by the community's estimated income
- Performance Above or Below Median: How much more or less, in dollars, each site would be expected to raise from this revenue stream if all sites raised the median share of wallet (as a percentage)
To display your first analysis, you need to make a few small changes to the template:
- On (4) ANALYSIS-Revenue Potential, adjust the chart to reflect the number of sites and revenue streams you included. Right click the chart, choose "Select data," and adjust the "Chart data range" so that it includes all your data.
- On (5) ANALYSIS-SOW Performance, first, select one of your revenue streams from the pull-down menu in cell A2. Having done that, adjust both charts to include all your sites and revenue streams (following the same process as above).
Before you analyze the data (discussed below in Step 6), you should repeat the analysis for other years and/or segments.
To do this for a different year of revenue, save a separate version of your completed analysis and simply add the revenue data you wish to compare. To do this for a different segment of sites, you also will create a separate version of the Excel template and include only the sites from the specific segment you plan to analyze—pasting in the new data as you did in Steps 2 and 4.
Below, Step 6 discusses how to analyze this data. As you explore the findings, you should compare them to other years' and other segments' analyses.
For example, was one year's total for a certain revenue stream skewed by a one-time event? If so, focus on results from another year. Can fundraising practices you learned from high-performing sites be applied to others? If not, they may be applicable only within a smaller segment of sites.
Step 6: Analyze the Data
Your analysis is now presented two different ways on the ANALYSIS tabs:
- The (4) ANALYSIS-Revenue Potential tab shows the overall landscape—the dollar value of raising your lower performing sites to median share-of-wallet performance across all the revenue streams you entered. Column B shows the combined value to each site, where Columns C and onward show the potential for each revenue stream.
- The (5) ANALYSIS-SOW Performance tab allows you to dive deeper into how your sites are performing in each revenue stream. Once you select a revenue stream from the dropdown menu, Columns A through E contain a ranking of the sites by their share of wallet and Columns G through I contain a ranking by fundraising performance above or below median share of wallet.
This analysis helps to answer three critical questions: 1. Who are my top performers? 2. How much variation is there and where does it occur? 3. How much value is there in raising lower performers to the median?
Who are my top performers?
Share of wallet, rather than performance, is the right statistic to understand who your top performers are—because it takes community income into account.
Columns A through E of the (5) ANALYSIS-SOW Performance tab (along with the graph of those numbers) show a ranking of your sites within the revenue stream you have selected, as well as where median share of wallet is. (Here share of wallet is expressed in dollars, for ease of comparison. For example, Miami's share of wallet for Major Gifts is described as $4.70 for every $100,000 in community income rather than as simply 0.004703 percent.)
This chart shows analysis for our sample nonprofit's Major Gifts revenue stream:
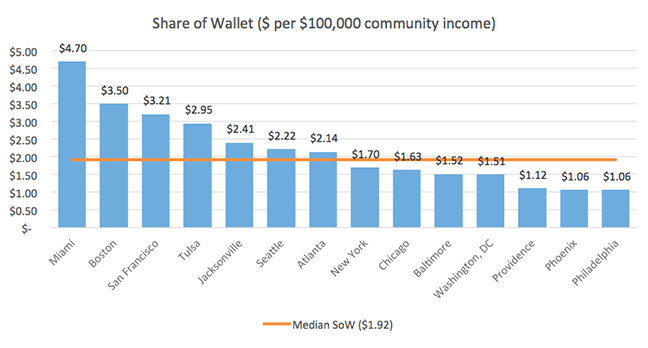
Four sites substantially outperform the median—and Miami is far above the rest. Jacksonville is also performing well.
It's important to calibrate the relevance of leading sites. If Misami is far above the rest because of a particular situation that other sites can't replicate (for example, the site might have been started by a key donor), you may want to spend more time trying to learn from Boston, San Francisco, etc.
Segmentation is also important here. It may be that Providence can learn much more from another small city like Tulsa than from the other top performers.
How much variation is there, and where does it occur?
You don't need to specifically calculate variation in order to understand it. Looking at the same chart above, you can see that our example nonprofit has a lot of variation in terms of share of wallet: the top performing site commands a share of wallet more than four times the lowest performing one. And there seems to be ample room to grow for the seven lower performing sites.
If this chart displayed little variation, you could look at another revenue stream. If you have any question about which revenue stream shows the most promise, understanding the dollar value of improving the underperforming sites (see below) will help.
How much value is there in raising lower performers to the median?
Answering this question requires the second calculation—the dollar value of raising lower performers to median share-of-wallet performance.
Site's Performance Above or Below Median
= Revenue Stream - (Median SOW X Total Community Income)
Columns G through I of the (5) ANALYSIS-SOW Performance tab (along with the graph of those numbers) display this calculation for the revenue stream you selected. This chart shows how our sample nonprofit's sites are performing at Major Gifts fundraising compared to a median site:

You can see that the four lowest performing sites could each potentially raise more than half a million dollars from Major Gifts if they performed like the median site. (Here, a negative number means underperformance, so if Baltimore were raising $278,000 more in Major Gifts, it would be a median site.)
On the other hand, as seen below for Gala revenue, only one site could improve by more than half a million.
The (4) ANALYSIS-Revenue Potential tab brings together the potential gains of all sites in a single data table and chart:

What sites offer the most potential?
For our example nonprofit, the total potential of improvements across all sites is $5.6 million, much of it from New York, Philadelphia, Phoenix, and Washington, DC. Those sites offer the greatest potential for growth
In this analysis, five other sites—Atlanta, Boston, Jacksonville, Miami, and Tulsa—show no potential for growth, meaning that each performed better than the median for all three revenue streams.
What revenue streams offer the most potential?
Three quarters of that $5.6 million comes from the Major Gifts revenue stream, where only a small fraction comes from Other Fundraising. (The total potential from each revenue stream can be found in Row 2 of the (4) ANALYSIS-Revenue Potential tab.) Given the small size of Other Fundraising, exploring effective practices there may not be worth the effort.
Is pursuing these improvements worth the investment?
Exploring sites' effective fundraising practices will require resources that you could use for something else. Looking at the combined total can help you understand whether doing so is worth the investment.
If you decide to try to learn from your top performing sites, comparing the dollar value of improvements to each of your revenue streams will help you prioritize your efforts and allocate resources effectively.